Tag Archives: Locking

Blocking Monitoring Framework: Capture and Analyze SQL Server Blocking and Deadlock Information With Event Notifications

If you worked with SQL Server for a while, you should have noticed how landscape changed over the years. We are dealing with the different problems now. Five years ago, majority of the issues I saw were related to non-optimized queries. There were the huge scans with a lot of  physical I/O and bad performance.

You do not see them as often nowadays. It is very cheap to solve the problems by upgrading the server. Put a couple hundred GBs of RAM and cache all the data; add more CPUs and problems magically disappear. The root-cause has not been fixed but who cares?

Surprisingly, there is one category of the issues that did not went away – concurrency. It even becomes worse. Modern servers handle more users and problems that did not exist with 50 concurrent users may put the server to its knees with 5000 users. I’ve been constantly involved in the troubleshooting of various concurrency issues and, in fact, I see more and more of them overtime.

Troubleshooting of the blocking and concurrency issues is, in the nutshells, a simple process. You need to identify the processes involved in blocking conditions or deadlocks and analyze why those processes acquire the locks on the same resources. In majority of cases, you need to analyze queries and their execution plans identifying possible inefficiencies that led to excessive number of locks being acquired.

Collecting this information is not a trivial task. The information is exposed through DMVs (you can download the set of scripts here); however, it requires you to run the queries at time when blocking occurred. Fortunately, SQL Server allows you to capture blocking and deadlock conditions with the blocked process report and deadlock graph, analyzing them later.

There is the caveat though. Neither blocked process report nor deadlock graph provide you execution plans of the statements. Nor do they always include affected statements in the plain text. You may need to query plan cache and other DMVs to get this information and longer you wait lesser is the chance that the information is available. Moreover, SQL Server may generate enormous number of blocked process reports in cases of prolonged blocking and complex blocking chains, which complicates the analysis.

This analysis may become very time consuming, especially if you need to deal with the large number of servers. Over the years, I have created the set of routines, which simplify it for me. I have been thinking to publish my scripts for a while, but I’ve never had time to polish them enough for public consumption. Until now – and I am very happy to share my collection with all of you. So allow me introduce the Blocking Monitoring Framework, which I am using with majority of my servers!

This framework is using Event Notifications. It captures blocked process report and deadlock graphs and parses them at time when event occurred and all data is still available in the system. All information is persisted in the set of tables for the further analysis.

The first version is available for download. I also promise you that I am going to support and enhance it in the future publishing the new versions on the regular basis.

Please feel free to contact me in case of any questions. I would also appreciate if you provide me any blocked process reports and deadlock graphs that framework was unable to parse. I will address the issues as quickly as I could.

Blocking Monitoring Framework

Locking in Microsoft SQL Server (Part 21) – Intro Into Transaction Management and Error Handling

As strange as it sounds, I have never considered transaction management to be the topic that requires explanation. However, it seems that some aspects of it are confusing and may benefit from the separate, long overdue, blog post.

Transaction Types

There are three types of transactions in SQL Server – explicit, autocommitted and implicit.

Explicit transactions are explicitly controlled by the code. You can start them by using BEGIN TRAN statement. They will remain active until you explicitly call COMMIT or ROLLBACK in the code.

In case, when there are no active transactions present, SQL Server would use autocommitted transactions – starting transactions and committing them for each statement it executes. Autocommitted transactions work on per-statement rather than per-module level. For example, when a stored procedure consists of five statements; SQL Server would have five autocommitted transactions executed. Moreover, if this procedure failed in the middle of execution, SQL Server would not roll back previously committed autocommitted transactions. This behavior may lead to logical data inconsistency in the system.

For the logic that includes multiple data modification statements, autocommitted transactions are less efficient than explicit transactions due to the logging overhead they introduce. In this mode, every statement would generate transaction log records for implicit BEGIN TRAN and COMMIT operations, which leads to the large amount of transaction log activity and degrade performance of the system.

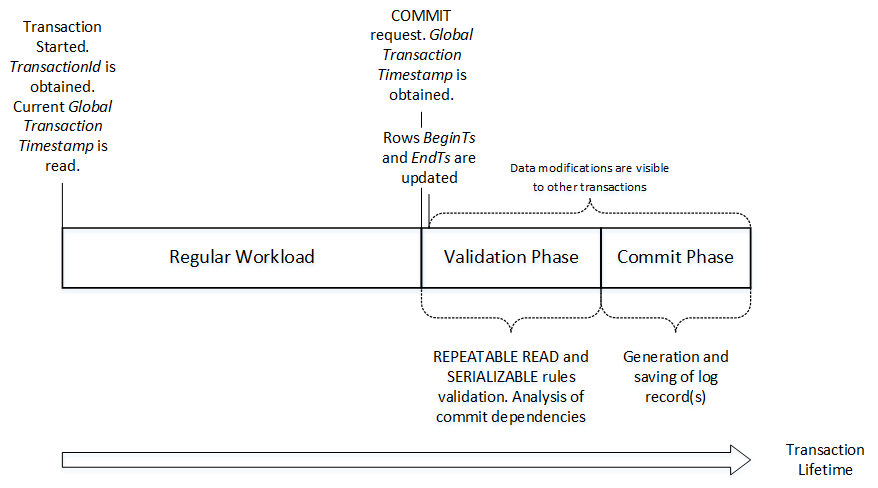
There is another potential performance hit caused by excessive number of autocommitted transactions. As you know, SQL Server implements Write-Ahead Logging to support transaction durability hardening log records on-disk synchronously with data modifications. Internally, however, SQL Server batches log write operations and caches log records in memory in small 60KB structures called log buffers. COMMIT log record forces SQL Server to flush log buffers to disk introducing synchronous I/O operation.

Figure 1 illustrates this condition. INSERT_1, UPDATE_1 and DELETE_1 operations run in autocommitted transactions generating additional log records and forcing log buffer to flush on each COMMIT. Alternatively, INSERT_2, UPDATE_2 and DELETE_2 operations run in implicit transaction, which leads to more efficient logging.

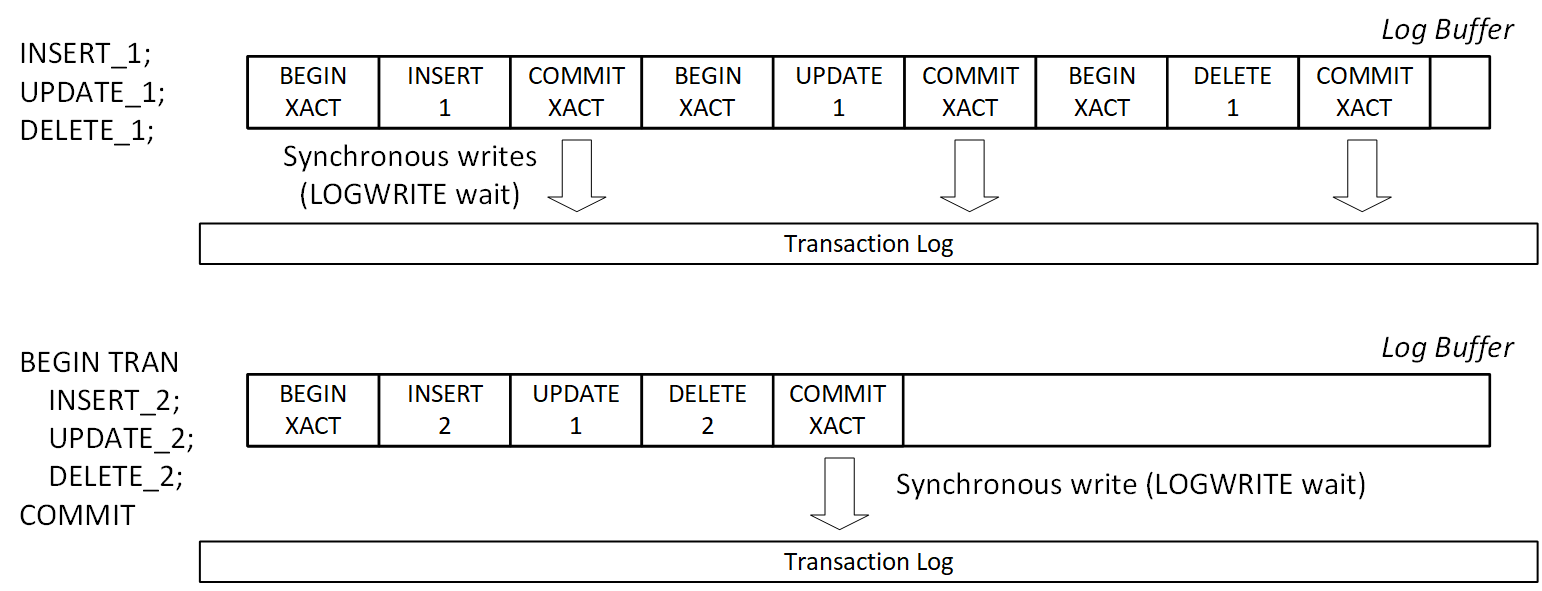
01. Transaction Logging with Autocommitted and Explicit Transactions

You can run the code below to see this overhead in action. It performs INSERT/UPDATE/DELETE sequence 10,000 times in the loop in autocommitted and explicit transactions respectively, measuring execution time and transaction log throughput with sys.dm_io_virtual_file_stats view.

create table dbo.TranOverhead
(
    Id int not null,
    Col char(50) null,
    constraint PK_TranOverhead
    primary key clustered(Id)
);

-- Autocommitted transactions
declare
    @Id int = 1,
    @StartTime datetime = getDate(),
    @num_of_writes bigint,
    @num_of_bytes_written bigint

select @num_of_writes = num_of_writes, @num_of_bytes_written = num_of_bytes_written
from sys.dm_io_virtual_file_stats(db_id(),2);

while @Id < 10000
begin
    insert into dbo.TranOverhead(Id, Col) values(@Id, 'A');

    update dbo.TranOverhead set Col = 'B' where Id = @Id;

    delete from dbo.TranOverhead where Id = @Id;

    set @Id += 1;
end;

select 
    datediff(millisecond, @StartTime, getDate()) as [Exec Time ms: Autocommitted Tran]
    ,s.num_of_writes - @num_of_writes as [Number of writes]
    ,(s.num_of_bytes_written - @num_of_bytes_written) / 1024 as [Bytes written (KB)]
from
    sys.dm_io_virtual_file_stats(db_id(),2) s;
go

-- Explicit Tran
declare
    @Id int = 1,
    @StartTime datetime = getDate(),
    @num_of_writes bigint,
    @num_of_bytes_written bigint

select @num_of_writes = num_of_writes, @num_of_bytes_written = num_of_bytes_written
from sys.dm_io_virtual_file_stats(db_id(),2);

while @Id < 10000
begin
    begin tran
        insert into dbo.TranOverhead(Id, Col) values(@Id, 'A');

        update dbo.TranOverhead set Col = 'B' where Id = @Id;

        delete from dbo.TranOverhead where Id = @Id;
    commit
    set @Id += 1;
end;

select 
    datediff(millisecond, @StartTime, getDate()) as [Exec Time ms: Explicit Tran]
    ,s.num_of_writes - @num_of_writes as [Number of writes]
    ,(s.num_of_bytes_written - @num_of_bytes_written) / 1024 as [Bytes written (KB)]
from
    sys.dm_io_virtual_file_stats(db_id(),2) s;

In my environment and this test, explicit transactions are about two times faster and generated three less log activity than autocommitted ones as shown in Figure 2.

02. Explicit and Autocommitted Transaction Performance

As the side note, SQL Server 2014 and above allows you to improve transaction log throughput by using delayed durability. In this mode, SQL Server does not flush log buffers when COMMIT log records are generated. This reduces the number of disk writes at cost of potential small data loss in case of disaster.

SQL Server also supports implicit transactions, which you can enable with SET IMPLICIT_TRANSACTION ON statement. When this option is enabled, SQL Server starts the new transaction when there is no active explicit transactions present. This transaction stays active until you explicitly issue COMMIT or ROLLBACK statement.

Implicit transactions may make transaction management more complicated and they are rarely used in production. However, there is the caveat – SET ANSI_DEFAULT ON option also automatically enables implicit transactions. This behavior may lead to unexpected concurrency issues in the system.

Error Handling

The error handling in SQL Server is the tricky subject especially with transactions involved. SQL Server would handle exceptions differently depending on error severity, active transaction context and several other factors.

Let’s look how exceptions affect control flow during execution. Listing below creates two tables- dbo.Customers and dbo.Orders – and populates them with the data. Note the existence of foreign key constraint defined in dbo.Orders table.

create table dbo.Customers
(
    CustomerId int not null,
    constraint PK_Customers
    primary key(CustomerId)
);

create table dbo.Orders
(
    OrderId int not null,
    CustomerId int not null,

    constraint FK_Orders_Customerss
    foreign key(CustomerId)
    references dbo.Customers(CustomerId)
);
go

create proc dbo.ResetData
as
begin
    begin tran
        delete from dbo.Orders;
        delete from dbo.Customers;
        insert into dbo.Customers(CustomerId) values(1),(2),(3);
        insert into dbo.Orders(OrderId, CustomerId) values(2,2);
    commit
end;

exec dbo.ResetData;

Let’s run three DELETE statements in one batch as shown below. The second statement will trigger a foreign key violation error. @@ERROR system variable provides the error number for the last T-SQL statement executed (0 means no errors).

delete from  dbo.Customers where CustomerId = 1; -- Success
select @@ERROR as [@@ERROR: CustomerId = 1];
delete from  dbo.Customers where CustomerId = 2; -- FK Violation
select @@ERROR as [@@ERROR: CustomerId = 2];
delete from  dbo.Customers where CustomerId = 3; -- Success
select @@ERROR as [@@ERROR: CustomerId = 3];
go

select * from dbo.Customers;

Figure 3 illustrates the output of the code. As you can see, SQL Server continues execution after non-critical foreign key violation error deleting a row with CustomerId=3 afterwards.

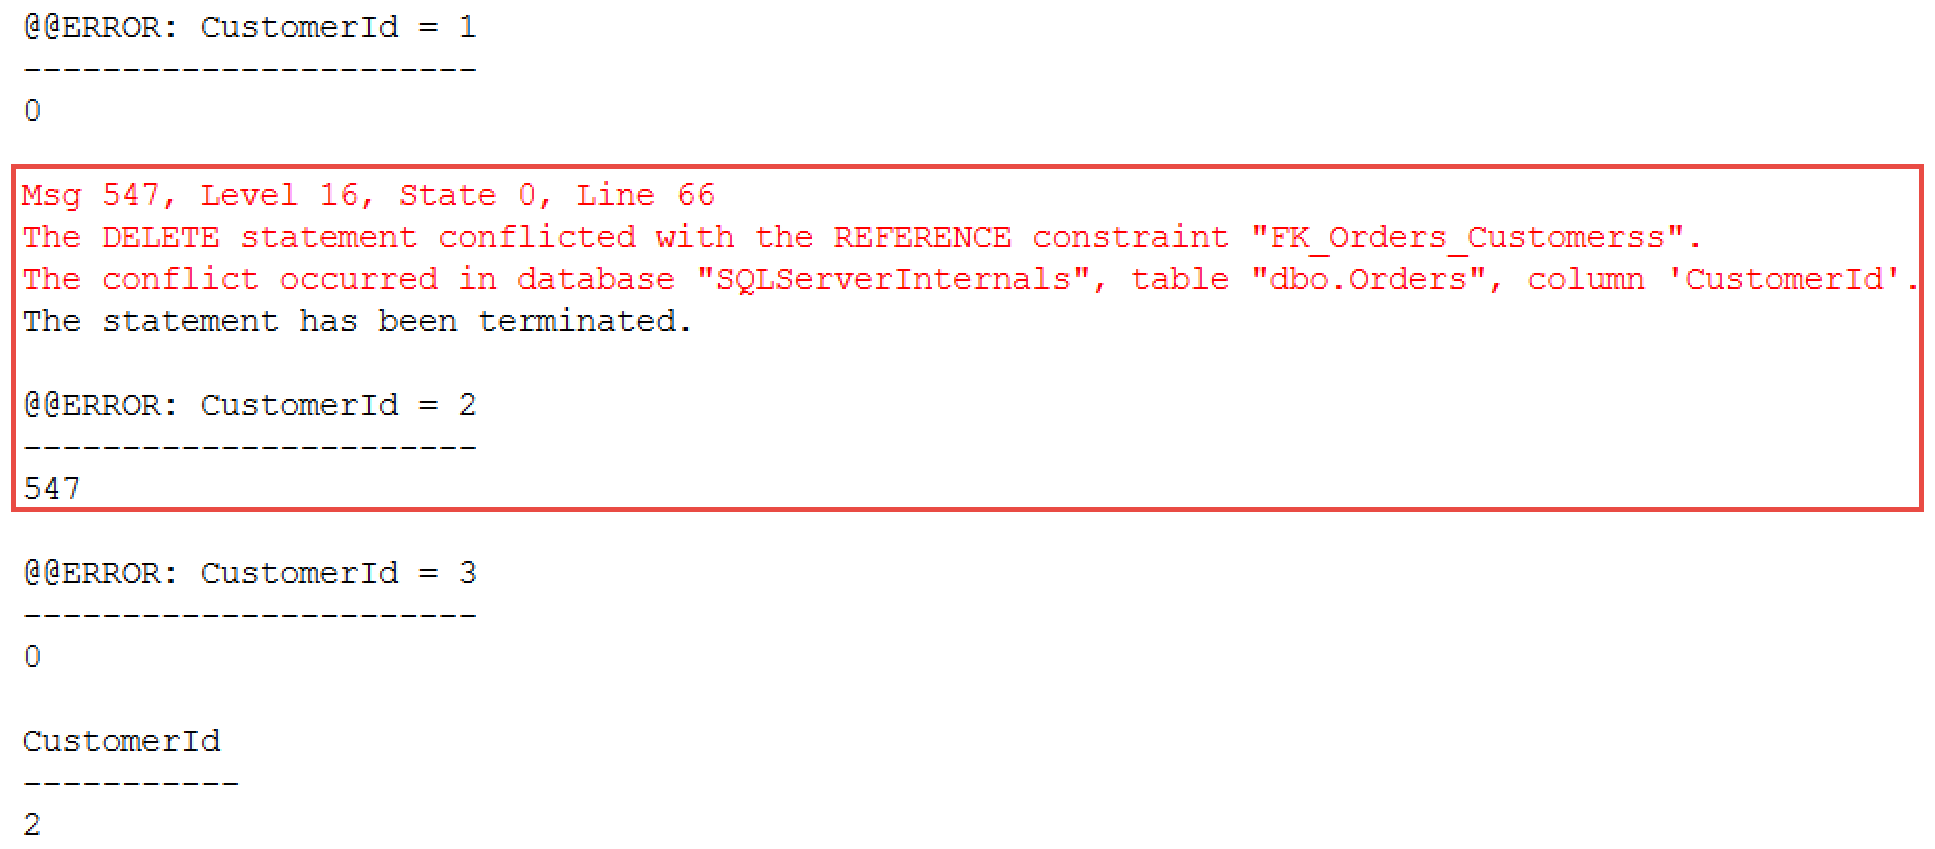
03. Running Three Autocommitted Transactions in a Batch

The situation would change when you use TRY..CATCH block as shown below.

exec dbo.ResetData;
go

begin try
    delete from  dbo.Customers where CustomerId = 1; -- Success
    delete from  dbo.Customers where CustomerId = 2; -- FK Violation
    delete from  dbo.Customers where CustomerId = 3; -- Not executed
end try
begin catch
    select 
        ERROR_NUMBER() as [Error Number]
        ,ERROR_LINE() as [Error Line]
        ,ERROR_MESSAGE() as [Error Message];
end catch
go

select * from dbo.Customers;

As you can see in Figure 4, the error was caught in the CATCH block and the third deletion statement has not been executed.

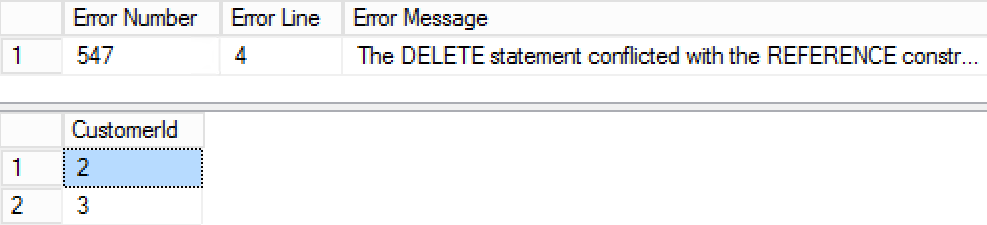
04. Running Three Autocommitted Transactions in TRY..CATCH block

Remember that non-critical exceptions do not automatically rollback explicit or implicit transactions regardless if TRY..CATCH block is present. You still need to commit or rollback transaction after the error.

Depending on severity of the error, transaction in which error occurred may be committable or become uncommittable and doomed. SQL Server would not allow you to commit uncommittable transactions and you must roll it back to complete it.

The XACT_STATE() function allows you to analyze the state of transaction and it returns one of three values:

  • 0 indicates that there is no active transactions present.
  • 1 indicates that there is an active and committable transaction present. You can perform any actions and data modifications committing transactions afterwards.
  • -1 indicates that there is an active uncommittable transaction present. You cannot commit such transaction.

There is very important SET option- XACT_ABORT– which allows you to control error-handling behavior in the code. When this option is set to ON, SQL Server treats every run-time error as severe, making transaction uncommittable. This prevents you from accidentally committing transactions when some data modifications failed with non-critical errors.

When XACT_ABORT is enabled, any error would terminate the batch when TRY..CATCH block is not present. For example, if you run the code from the second code sample above again using SET XACT_ABORT ON, the third DELETE statement would not be executed and only the row with CustomerId=1 will be deleted. Moreover, SQL Server would automatically rollback doomed uncommitted transaction after the batch completes.

The code below shows this behavior. The stored procedure dbo.GenerateError sets XACT_ABORT to ON and generates an error within the active transaction. @@TRANCOUNT variable returns the nested level of transaction (more on it later) and non-zero value indicate that transaction is active.

create proc dbo.GenerateError
as
begin
    set xact_abort on
    begin tran
        delete from dbo.Customers where CustomerId = 2; -- Error
        select 'This statement will never be executed';
end
go

exec dbo.GenerateError;
select 'This statement will never be executed';
go

-- Another batch
select XACT_STATE() as [XACT_STATE()], @@TRANCOUNT as [@@TRANCOUNT];
go

Figure 5 illustrates the output of the code. As you can see, batch execution has been terminated and transaction has been automatically rolled back at the end of the batch.

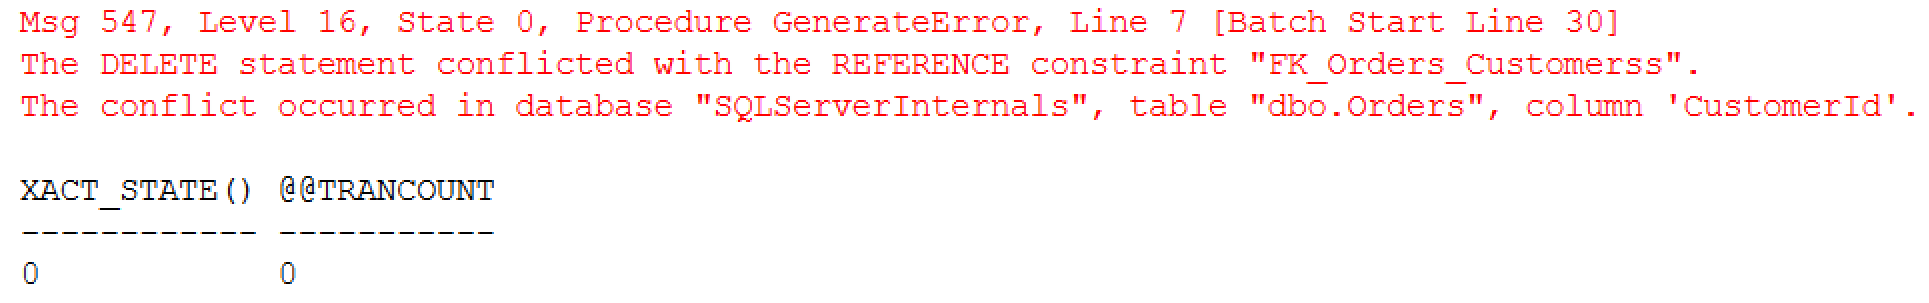
505. XACT_ABORT behavior (no TRY..CATCH block)

TRY..CATCH block, however, will allow you to capture the error even with XACT_ABORT set to ON.

begin try
    exec dbo.GenerateError;
    select 'This statement will never be executed';
end try
begin catch
    select 
        ERROR_NUMBER() as [Error Number]
        ,ERROR_PROCEDURE() as [Procedure]
        ,ERROR_LINE() as [Error Line]
        ,ERROR_MESSAGE() as [Error Message];

    select 
        XACT_STATE() as [XACT_STATE()]
        ,@@TRANCOUNT as [@@TRANCOUNT];

    if @@TRANCOUNT > 0
        rollback;
end catch

As you can see in Figure 6, exception has been trapped in the CATCH block with transaction still remain active there.

06. XACT_ABORT Behavior (with TRY..CATCH block)

Consistent error handling and transaction management strategies are extremely important and allow to avoid data consistency errors and improve data quality in the system. I would recommend the following approach as the best practice:

  • Always use explicit transactions in the code during data modifications. This would guarantee data consistency in transactions that consists of multiple operations. It is also more efficient comparing to individual autocommitted transactions.
  • Set XACT_ABORT to ON before data modifications. This would guarantee “all-or-nothing” behavior of the transaction preventing SQL Server from ignoring non-severe errors and committing partially completed transactions.
  • Use proper error handling with TRY..CATCH blocks and explicitly rollback transactions in case of exceptions. This helps to avoid unforeseen side effects in case of the errors.

The choice between client-side and server-side transaction management depends on application architecture. Client-side management is required when data modifications are done in the application code, for example changes are generated by ORM frameworks. On the other hand, stored procedure-based data access tier may benefit from server-side transaction management.

The code below provides the example of the stored procedure that implements server-side transaction management.

create proc dbo.PerformDataModifications
as
begin
    set xact_abort on
    begin try
        begin tran
            /* Perform required data modifications */
        commit
    end try
    begin catch
        if @@TRANCOUNT > 0 -- Transaction is active
            rollback;
        /* Addional error-handling code */
        throw;  -- Re-throw error. Alternatively, SP may return the error code
    end catch;
end;

Nested Transactions

SQL Server technically supports nested transactions; however, they are primarily intended to simplify transaction management during nested stored procedure calls. In practice, it means that the code needs to explicitly commit all nested transactions and the number of COMMIT calls should match the number of BEGIN TRAN calls. The ROLLBACK statement, however, rolls back entire transaction regardless of the current nested level.

The code below demonstrates this behavior. As I already mentioned, system variable @@TRANCOUNT returns the nested level of the transaction.

select @@TRANCOUNT as [Original @@TRANCOUNT];
begin tran
    select @@TRANCOUNT as [@@TRANCOUNT after the first BEGIN TRAN];
    begin tran
        select @@TRANCOUNT as [@@TRANCOUNT after the second BEGIN TRAN];
    commit
    select @@TRANCOUNT as [@@TRANCOUNT after nested COMMIT];    
    begin tran
        select @@TRANCOUNT as [@@TRANCOUNT after the third BEGIN TRAN];
    rollback
select @@TRANCOUNT as [@@TRANCOUNT after ROLLBACK];
rollback; -- This ROLLBACK generates the error

You can see the output of the code in Figure 7 below.

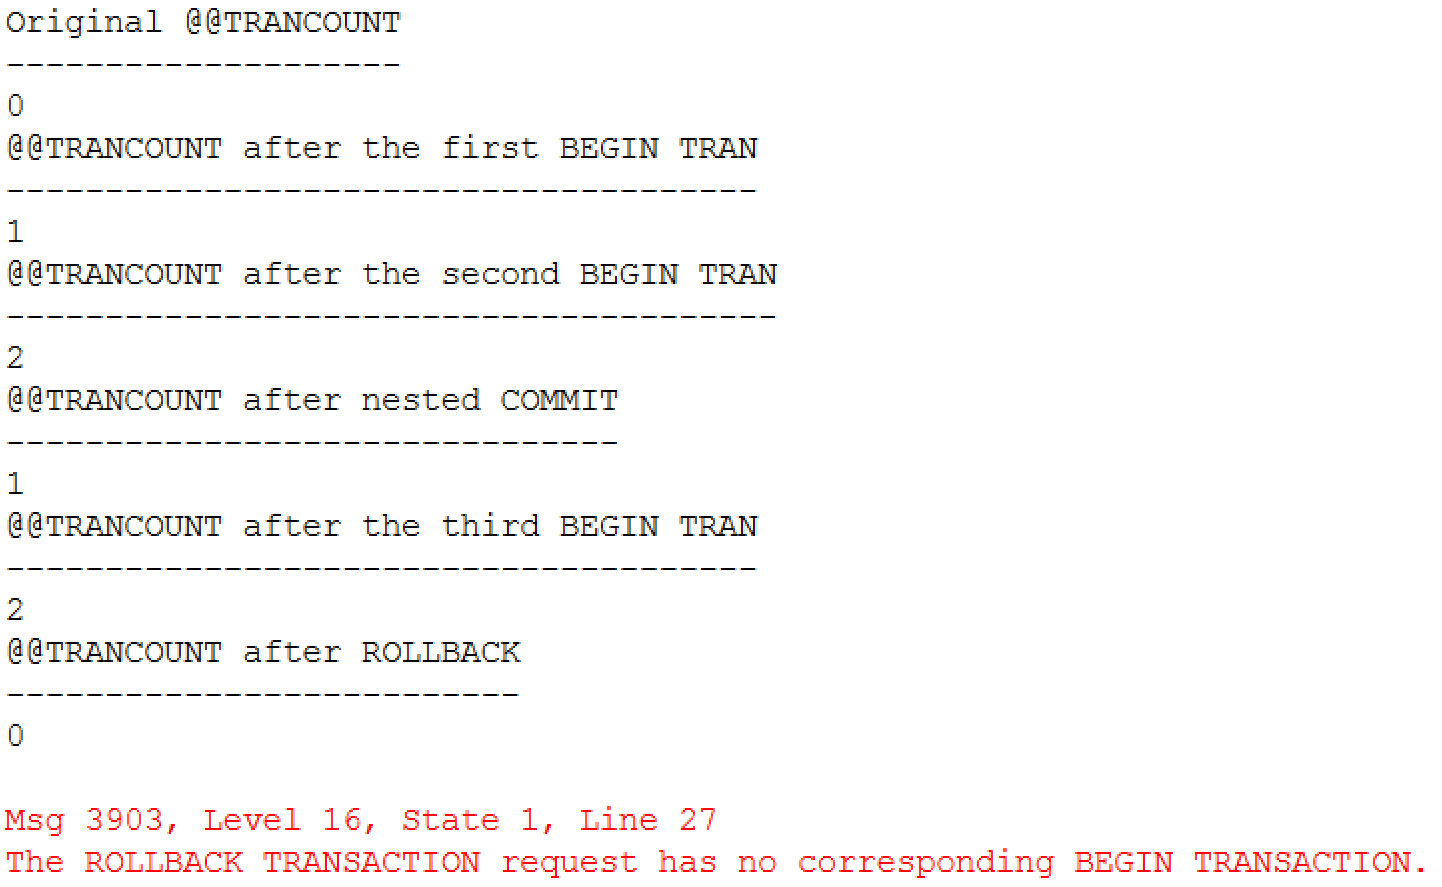
07. Nested Transactions

You can save the state of transaction and create a savepoint by using SAVE TRANSACTION statement. This will allow you to partially rollback a transaction returning to the most recent savepoint. The transaction will remain active and needs to be completed with explicit COMMIT or ROLLBACK statement later.

It is worth noting that uncommittable transactions with XACT_STATE() = -1 cannot be rolled back to savepoint. In practice, it means that you cannot rollback to savepoint after an error if XACT_ABORT is set to ON.

The code below illustrates savepoints in action. The stored procedure creates the savepoint when it runs in active transaction and rolls back to this savepoint in case of committable error.

create proc dbo.TryDeleteCustomer
(
    @CustomerId int 
)
as
begin
    -- Setting XACT_ABORT to OFF for rollback to savepoint to work
    set xact_abort off

    declare
        @ActiveTran bit

    -- Check if SP is calling in context of active transaction
    set @ActiveTran = IIF(@@TranCount > 0, 1, 0);

    if @ActiveTran = 0
        begin tran;
    else 
        save transaction TryDeleteCustomer;

    begin try
        delete dbo.Customers where CustomerId = @CustomerId;

        if @ActiveTran = 0
            commit;
        return 0;
    end try
    begin catch
        if @ActiveTran = 0 or XACT_STATE() = -1
        begin
            -- Rollback entire transaction
            rollback tran; 
            return -1; 
        end
        else begin
                -- Rollback to savepoint 
            rollback tran TryDeleteCustomer; 
            return 1; 
        end
    end catch;
end;
go

-- Test
declare
    @ReturnCode int

exec dbo.ResetData; 

begin tran
    exec @ReturnCode = TryDeleteCustomer @CustomerId = 1;
    select 
        1 as [CustomerId]
        ,@ReturnCode as [@ReturnCode]
        ,XACT_STATE() as [XACT_STATE()];
    
    if @ReturnCode >= 0
    begin
        exec @ReturnCode = TryDeleteCustomer @CustomerId = 2;
        select 
            2 as [CustomerId]
            ,@ReturnCode as [@ReturnCode]
            ,XACT_STATE() as [XACT_STATE()];    
    end
if @ReturnCode >= 0
    commit;
else 
    if @@TRANCOUNT > 0
        rollback;
go

select * from dbo.Customers;

The test triggered foreign key violation during the second dbo.TryDeleteCustomer call. This is non-critical error and, therefore, the code is able to commit after it as shown in Figure 8.

08. Transaction Has Been Committed After Rollback to Savepoint

It is worth noting that this example is shown for demonstration purposes only. From efficiency standpoint, it would be better to validate referential integrity and existence of the orders before deletion occurred rather than catching exception and rolling back to savepoint in case of an error.

I hope that those examples provided you the good overview of transaction management and error handling strategies in the system. If you want to dive deeper, I would strongly recommend you to read the great article by Erland Sommarskog, which provides you much more details on the subject.

Source code is available for download.

Table of Context

Locking in Microsoft SQL Server (Part 20) – Range lock (RangeS-U) deadlock due to IGNORE_DUP_KEY index option

As you know, SQL Server uses range locks to protect the range of the index keys. This usually happens in SERIALIZABLE isolation level. This level prevents phantom and non-repeatable reads phenomena and it guarantees that queries executed in transaction will always obtain the same set of data every time they were executed.

As the simple example, consider the table with ID column and two rows with ID = 1 and ID = 10. In SERIALIZABLE isolation level, the query that selects data from the table should always obtain those and only those two rows if you run it multiple times. SQL Server uses shared range lock protecting ID key range interval of (1..10), which guarantees that other transactions would not be able to update or delete existing rows nor insert any new rows into the interval.

In contrast, REPEATABLE READ isolation level uses row locks rather than range locks. They would prevent modifications of existing rows- 1 and 10- but would not prevent other transactions from inserting rows into the interval and introducing phantom read phenomena.

The range locks are usually acquired only in SERIALIZABLE isolation level; however, there is another, pretty much undocumented case, when SQL Server can use those locks. It happens even in READ UNCOMMITTED and READ COMMITTED SNAPSHOT modes when you have nonclustered indexes that have IGNORE_DUP_KEY=ON option. In that case rows with the duplicated index keys would not raise an error but rather being ignored. SQL Server would not insert then into the table.

This behavior leads to very hard to explain cases of blocking and even deadlocks in the system. Let’s look at the example and create the table with a few rows as shown below. As you see, nonclustered index on the table has IGNORE_DUP_KEY option enabled.

create table dbo.IgnoreDupKeysDeadlock
(
    CICol int not null,
    NCICol int not null
);

create unique clustered index IDX_IgnoreDupKeysDeadlock_CICol
on dbo.IgnoreDupKeysDeadlock(CICol);

create unique nonclustered index IDX_IgnoreDupKeysDeadlock_NCICol
on dbo.IgnoreDupKeysDeadlock(NCICol)
with (ignore_dup_key = on);

insert into dbo.IgnoreDupKeysDeadlock(CICol, NCICol)
values(0,0),(5,5),(10,10),(20,20);

Now let’s start transaction in READ UNCOMMITTED mode and insert the row into the table checking the locks session acquired.

set transaction isolation level read uncommitted
begin tran
    insert into dbo.IgnoreDupKeysDeadlock(CICol,NCICol) values(1,1);

    select request_session_id, resource_type, resource_description
        ,resource_associated_entity_id, request_mode, request_type, request_status
    from sys.dm_tran_locks
    where request_session_id = @SPID;

As you can see in Figure 1, INSERT statement acquired and held two exclusive (X) locks on the rows inserted into clustered and nonclustered indexes. It also obtained Range (RangeS-U) lock on nonclustered index. RangeS-U means that the key range is protected with the shared (S) lock and SQL Server uses update (U) scan within the range.

01. Locks Held by the Session

01. Locks Held by the Session

You may ask the obvious question – why the range lock is required? The reason is the way how SQL Server handles modifications of the data. The data is always inserted into or updated in the clustered index first followed by nonclustered index updates. With IGNORE_DUP_KEY=ON, SQL Server should prevent the situation when the duplicated keys were inserted into nonclustered index simultaneously after clustered index insert was done and, therefore, clustered index insert needs to be rolled back. Thus, it locks nonclustered index key range before any data modifications preventing other sessions from inserting any rows there.

You can confirm it by looking at lock_acquired xEvent events as it is show in Figure 2. As you can see, the RangeS-U lock is acquired before exclusive (X) locks on the resources.

02. lock_acquired Events During Insert

02. lock_acquired Events During Insert

The key problem here, however, is that RangeS-U lock behaves the same way as in SERIALIZABLE isolation level and it is held until the end of transaction. Moreover,  RangeS-U locks are incompatible with each other.  That can lead to very unpleasant and hard to understand deadlocks.

Let’s run the code shown below in another session. The first INSERT would succeed (it is in the different key range in the index). The second, however, would be blocked due to RangeS-U/RangeS-U lock incompatibility.

set transaction isolation level read uncommitted
begin tran
    -- Succeed
    insert into dbo.IgnoreDupKeysDeadlock(CICol,NCICol)	values(12,12);
    -- Blocked
    insert into dbo.IgnoreDupKeysDeadlock(CICol,NCICol) values(2,2);
commit

If we checked the locks held by the both sessions now, we would see the picture shown in Figure 3. You can see that session 2 successfully acquired the first range lock but the second range lock request is blocked due to incompatible range lock on the same key interval held by the session 1.

03. Locks Held by Both Sessions

03. Locks Held by Both Sessions

Finally, if we run another INSERT in the session 1 into the range locked by the session 2, it would be also blocked with the typical deadlock condition.

    insert into dbo.IgnoreDupKeysDeadlock(CICol,NCICol) values(11,11);
commit

Figure 4 shows you the deadlock graph.

04. Deadlock Graph

04. Deadlock Graph

Unfortunately, there is very little you can do about that. The only way to address the problem is removing IGNORE_DUP_KEY option from the index handling duplicates in the different ways. It may or may not work for you.

Finally, it is worth mentioning, that SQL Server does not use range locks in case of clustered indexes with IGNORE_DUP_KEY=ON option. Clustered indexes are modified first and SQL Server could detect duplicated keys at this stage without any extra range locking required.

Source code is available for download.

Table of Content.

Reducing Offline Index Rebuild and Table Locking Time in SQL Server

Enterprise Edition of SQL Server is all about availability features. It allows you to build robust High Availability and Database Maintenance strategies, which are the must for the mission critical systems. Unfortunately, all those benefits come at cost. At very high cost. Enterprise Edition of SQL Server is anything but cheap. Enterprise Edition licenses usually several times more expensive comparing to the Standard Edition licenses. It applies to both, on-premises and Cloud installations. For example, in Microsoft Azure, VMs with Enterprise Edition are about 4 times more expensive comparing to Standard Edition VMs.

Not every business can afford Enterprise Edition. And, to be honest, not every business even need Enterprise edition. It is entirely possible to build relatively big and complex solutions with Standard Edition of SQL Server especially with SQL Server 2014, which can utilize 128GB of RAM. I have personally worked with several multi-TB databases using Standard Edition of SQL Server.

One of the common challenges with non-Enterprise Editions, however, is Index Maintenance. Enterprise Edition allows you to rebuild indexes keeping table online. It uses row-versioning similar to optimistic transaction levels under the hood. With exception of short-time shared (S) at the beginning and schema-modification (Sch-M) locks at the end of the execution, there are no full table locks held. Other users can access the table, and read, and modify data from there.

Unfortunately, this is not the case with the Standard Edition where only offline index rebuild is supported. Offline index rebuild acquires schema modification (Sch-M) lock for the duration of the execution, which blocks entire access to the table even in read uncommitted transaction isolation level. Based on the index size, rebuild can be very time consuming operation. Obviously, you can use index reorganize instead of rebuild., which is online operation. However, it does not work as good as index rebuild on heavily fragmented tables.

Today, I am going to show you very simple technique that can help to decrease offline index rebuild time, and, therefore, time when table is inaccessible for the other sessions. It is not the magic silver bullet that helps everywhere. In fact, in some of the cases, it could even hurt rather than help. We will discuss that later in the post.

I am going to use a table from one of my production systems. That table has a couple dozen columns including one nvarchar(max) column, which is hosting some LOB data. I have rebuilt the index before the tests making sure that initial fragmentation does not affect execution time on the first test run.

As you see in Figure 1 below, leaf level of the clustered index for IN-ROW data consist of 20,374 pages, which is about 159MB of data. LOB data consists of 76,708 pages, which is about 600MB of data.

01. Index Physical Stats

As the first step, let’s run ALTER INDEX REBUILD statement and measure execution time for the operation. I am clearing buffer pool emulating a cold cache before the test (DO NOT RUN IT IN PRODUCTION!). This is, obviously, the worst case scenario – in the real life, at least some of the data pages would be cached at time of the index rebuild operation.

I am also running index rebuild without parallelism involved just to make sure that results are consistent and simplify the analysis. As the side note, my test server has pretty slow I/O subsystem, and execution time without MAXDOP=1 hint is just about the same as with the hint.

-- Clearing buffer pool. DO NOT RUN IN PRODUCTION
checkpoint
go

dbcc dropcleanbuffers
go

-- Rebuilding Index
alter index IDX_CI on dbo.MyTable rebuild with (maxdop = 1)

As you can see in Figure 2, index rebuild time in my system is 1 minute and 24 seconds. As you know, other sessions would be unable to access the table during this time due to schema modification (Sch-M) lock held on the table.

02. Execution Time of Index Rebuild with the Cold Cache

Let’s repeat our test (again, with cold cache) and analyze session waits during the index rebuild. We can do it by creating Extended Event session with the code shown below. This code will work in SQL Server 2012 and 2014 and will require slight modifications in SQL Server 2008/2008 R2.

create event session [Waits] on server
add event sqlos.wait_info
(
	action (sqlserver.session_id)
	where
	(
		sqlserver.session_id = 141 -- @@SPID of the session with index rebuild)
		and opcode = 1 -- END of wait
	)
)
add target package0.event_file(SET filename=N'C:\ExtEvents\Waits.xel',max_rollover_files=(0))
with
(
	max_memory=4096 KB
	,event_retention_mode=allow_single_event_loss
	,max_dispatch_latency=10 SECONDS
)
go

alter event session [Waits] on server state = start

After index rebuild command, let’s stop the session and look at the waits that occur during index rebuild.

alter event session [Waits] on server
state = stop
go

;with EventData(event_data)
as
(
	select cast(event_data AS XML) AS event_data
	from sys.fn_xe_file_target_read_file
		('C:\ExtEvents\Waits*.xel',null,null,null)
)
,Waits
as
(
	select
        event_data.value ('(/event/@timestamp)[1]'
			, 'datetime') as [Time],
        event_data.value ('(/event/data[@name=''wait_type'']/text)[1]'
			,'varchar(255)') AS [Wait],
        event_data.value ('(/event/data[@name=''duration'']/value)[1]'
			,'bigint') AS [Duration],
        event_data.value ('(/event/data[@name=''signal_duration'']/value)[1]'
			,'bigint') AS [Signal]
	from EventData
)
select 
	w.[Wait]
	,count(*) as [Count]
	,sum(w.Duration) as [Total Duration (ms)]
	,sum(w.Duration) - sum(w.Signal) as [Resource Waits (ms)]
	,sum(w.Signal) as [Signal Waits (ms)]
from Waits w
group by w.[Wait]

As you can see in the Figure 3 below, the vast majority of the waits are PAGELATCHIO*, which occur when SQL Server is waiting for the data page to be read from the disk.

03. Waits during Index Rebuild with the Cold Cache

That discovery can point us to the right direction. If large portion of index rebuild was waiting for the data to be read from disk, we could speed up the process by pre-fetching and caching data in the memory. SQL Server would not need to perform physical read operations, which should reduce rebuild time.

Let’s try that and run the following select below (again, making sure that we are using cold cache for test sake):

checkpoint
go

dbcc dropcleanbuffers
go


declare
	@T1 bigint, @T2 bigint

select 
	@T1 = avg(RecId) -- Making sure that IN_ROW pages are read
	,@T2 = avg(len(LOB_Column)) -- Making sure that LOB pages are read
from dbo.MyTable with (nolock, index=IDX_CI) 
option (maxdop 1)

I am forcing the scan of the clustered index – the one, which we are going to rebuild. I am using read uncommitted transaction isolation level with NOLOCK hint. As you can guess, in this situation I do not worry about any data consistency issues that can arise.

However, there is very important part – we need to make sure that SQL Server reads LOB data pages in addition to IN_ROW data pages. We can force it by accessing our LOB column in the select list. You can use the same technique dealing with ROW_OVERFLOW pages in case, if index has such allocation units.

Finally, I am also referencing one of columns from IN_ROW data to make sure that those pages are also read into the memory. In some cases, with the large tables and read uncommitted transaction isolation level, SQL Server can choose to use allocation unit scans instead of index scan. I seriously doubt, that SQL Server can perform such operation and scan only LOB data pages in our select, especially with the index hint in use, but it is better to be safe than sorry.

The execution time of the select in my system is 1 minute and 3 seconds as it is shown in Figure 4 below.

04. Execution Time of Select Statement

Now, let’s run index rebuild again. As you see, with index pages cached in memory, index rebuild time is just 10 seconds as it is shown in Figure 5. Even though, total time of both operations (select and index rebuild) are comparable with original index rebuild over cold cache, the time when table was inaccessible due to schema modification (Sch-M) lock is about 8 times less than before.

05. Execution Time of Index Rebuild when Data is Cached

If you looked at the waits during the last index rebuild, you would see that PAGELATCHIO* waits practically disappeared as it is shown in Figure 6.

06. Waits During Index Rebuild with the Warm Cache

While this technique can significantly reduce blocking during offline index rebuild, it is not for everyone. First, and foremost, you should be careful in case of the large indexes especially when system has limited amount of memory and/or low page life expectancy. Caching large indexes will require significant amount of memory and, therefore, it could lead to the situations when you flush the buffer pool possibly flushing the index pages you just read. This is especially important if you expect data growth in the future. Small indexes today can become the large ones tomorrow.

Second, it is beneficial to analyze how many pages in the index are typically cached in memory. Obviously, if most part of the pages have been already cached, you would not get much gain from running the select and pre-fetching remaining pages to the memory. On the other hand, logical reads are fast anyway so select over warm cache would not take much time.

You can use the script below to analyze number of pages from the index that have been cached. You can compare those numbers with results of sys.dm_db_index_physical_stats to estimate the number of cached pages per allocation unit from the index.

select i.name, au.type_desc, count(*) as [Cached Pages]
from 
	sys.dm_os_buffer_descriptors bd with (nolock) 
        join sys.allocation_units au with (nolock) on 
		    bd.allocation_unit_id = au.allocation_unit_id
	join sys.partitions p with (nolock) on
		(au.type in (1,3) and au.container_id = p.hobt_id) or
		(au.type = 2 and au.container_id = p.partition_id)
	join sys.indexes i with (nolock) on
		p.object_id = i.object_id and 
		p.index_id = i.index_id
where
	bd.database_id = db_id() and
	p.object_id = object_id (N'dbo.MyTable') and 
	p.index_id = 1 -- ID of the index
group by
	i.name, au.type_desc

Finally, that technique is useful when the biggest bottleneck in the system is I/O performance as it happened in my case. This often happens in the Cloud-based systems (SQL Server in VMs) where I/O latency is usually high and Standard Edition of SQL Server is commonly used due to its cost. In that scenario, pre-fetching data to the cache could significantly reduce the locking time for offline index rebuild when you have enough memory for the index data.

Locking in Microsoft SQL Server (Part 19) – Concurrency model in in-memory OLTP (Hekaton)

It is impossible to resist the urge of exploring in-memory OLTP Engine (code name Hekaton) released as part of SQL Server 2014. This technology can provide you huge performance boost, assuming, of course, that you can live within surface area limitations. Nevertheless, internal implementation of in-memory OLTP is fascinating. Almost everything is done differently than what you get used to with SQL Server Storage Engine. To put things into prospective, I seriously considered to name this post as “Concurrency – upside down”. 🙂

Today, I want to focus on particular aspect of in-memory OLTP, such as its concurrency model. While implementation of SNAPSHOT isolation is more or less obvious, I was intrigued, how higher isolation levels, such as REPEATABLE READ and SERIALIZABLE, would work in latch- and lock-free environment.

I assume, that you have a basic understanding of key principles used in-memory OLTP. Otherwise, you can consider to read MSDN documentation and Kalen Delaney’ whitepaper at first.

Even though, I am not going to focus much on in-memory OLTP indexes and access methods, I would like to reiterate how Hekaton works with the data. It uses completely different  mechanism comparing to regular on-disk tables. The data rows live in memory and linked to each other in single-linked list of pointers – one pointer chain per index.

Concurrency model in in-memory OLTP is a version-based supporting multiple versions of the rows with different lifetime. SQL Server maintains two different unique values, such as:

  • Global Transaction Timestamp is auto-incremented value, which is uniquely identifying every transaction in the system. SQL Server increments this value at transaction pre-commit stage.
  • TransactionId is another identifier (timestamp), which is also uniquely identifies a transaction. SQL Server obtains and increments its value at moment when transaction starts.

Every row has BeginTs and EndTs timestamps, which correspond to a Global Transaction Timestamp of the transaction that created or deleted this version of a row.  A special timestamp value, called Infinity, is used to indicate rows that have not been deleted (EndTs=Infinity). SQL Server never updates rows. When row needs to be modified, it deletes (updates EndTs) of original row and create a new row version with a new timestamp and EndTs of Infinity.

A transaction can only see rows that existed at time of transaction start, which is similar to SNAPSHOT isolation levels for on-disk tables. However, for in-memory data that behavior does not change with isolation level. REPEATABLE READ and SERIALIZABLE isolation levels follow exactly the same rules.

Figure 1 illustrates an example of data access and visibility. It shows hash index on Name (on left  side) and multiple data rows linked into that index pointer chain. Again, if you do not know what hash index is, consider to read about it in documentation. For simplicity sake, let’s consider that hash function is based on the first letter of the Name.

01. Hash index and data rows

Let’s assume that we need to run a query that selects all rows with Name=’Ann’ in the transaction that started when Global Transaction Timestamp was 65. SQL Server calculates hash value for Ann, which is ‘A‘ and find corresponding bucket in the hash index. It follows the pointer from that bucket, which references a row with Name=’Adam’. This row has BeginTs of 10 and EndTs of Infinity; therefore, it is visible to the transaction. However, Name value does not match the predicate and row is ignored.

As the next step, SQL Server follows the pointer from Adam index pointer array, which references first Ann row. This row has BeginTs of 50 and EndTs of Infinity; therefore, it is visible to the transaction and needs to be selected.

As the final step, SQL Server follows the next pointer in the index. Even though, last row also has Name=’Ann’, it has EndTs of 50, which indicates that row has been deleted before transaction started and it is invisible to the transaction.

I hope, that provides you very basic example of access methods and data visibility used in in-memory OLTP. However, before we start diving deeper into internal implementation of concurrency model in Hekaton, I would like us to remember about data logical consistency rules provided by different transaction isolation levels.

Any transaction isolation level resolve write/write conflicts. Multiple transactions cannot update a same row simultaneously. Different outcomes are possible, in some cases, SQL Server uses blocking and preventing transactions from accessing uncommitted changes until transaction that made those changes is committed. In other cases, SQL Server rolls back one of transactions due to update conflict. In-memory OLTP uses latter method to resolve write/write conflicts and abort the transaction. We will discuss this situation later, and now let’s focus on the read data consistency.

There are three major data inconsistency issues possible in multi-user environments, such as:

Dirty Reads: Transaction reads uncommitted (dirty) data from the other uncommitted transactions.

Non-Repeatable Reads: Subsequent attempts to read the same data from within the same transaction returns different results. This data inconsistency issue arises when the other transactions modified, or even deleted, data between the reads done by affected transaction.

Phantom Reads: This phenomenon occurs when subsequent reads within the same transaction return the new rows (the ones transaction did not read before). This happens when another transaction inserted the new data in between the reads done by affected transaction.

Figure 2 below shows data inconsistency issues that are possible for different transaction isolation levels.

02. Transaction isolation levels and data consistency

With exception of SNAPSHOT isolation level, SQL Server uses locking to address data inconsistency issues when dealing with on-disk tables. It blocks sessions from reading or modifying data to prevent data inconsistency. Such behavior also means that in case of write/write conflict, last modification wins. For example, when two transactions are trying to modify a same row, SQL Server blocks one of transactions until another transaction is committed allowing blocked transactions to modify data afterwards. No errors or exceptions would be raised, however changes from the first transactions would be lost.

SNAPSHOT isolation level uses row-versioning model where all data modifications done by other transactions are invisible for the transaction. It is implemented differently in case of on-disk and memory-optimized tables however, logically it behaves the same. Write/write conflicts in that model are resolved by aborting and rolling back the transactions.

It is also worth mentioning that even though SERIALIZABLE and SNAPSHOT isolation levels provide the same level of protection against data inconsistency issues, there is a subtle difference in their behavior. With SNAPSHOT isolation level transaction sees a data as of at beginning of transaction. With SERIALIZABLE isolation level, transaction sees a data as of a time when data was accessed a first time. Consider a situation when session is reading data from a table in the middle of transaction. If another session changed data in that table after transaction started but before data was read, transaction in SERIALIZABLE isolation level would see the changes while SNAPSHOT transaction would not.

As I already mentioned, In-memory OLTP supports three transaction isolation levels – SNAPSHOT, REPEATABLE READ and SERIALIZABLE. However, in-memory OLTP uses completely different approach to enforce data consistency rules comparing to on-disk tables. Rather than block or being blocked by the other sessions, in-memory OLTP validates data consistency at transaction commit time throwing exception and rolling back the transaction if rules were violated. This is very confusing behavior comparing to on-disk tables – transaction is continue working without being blocked. It returns data to clients; however it is failed to commit in the end.

Let’s look at a few examples that demonstrates such behavior. As the first step let’s create memory-optimized table and insert a few rows there.

create table dbo.HKData
(
     ID int not null,
     Col int not null,
     constraint PK_HKData
     primary key nonclustered hash(ID)
     with (bucket_count=64),
)
with (memory_optimized=on, durability=schema_only);

insert into dbo.HKData(ID, Col)
values(1,1),(2,2),(3,3),(4,4),(5,5);

Figure 3 shows two examples how REPEATABLE READ transactions handle non-repeatable and phantom reads. Session 1 transaction starts at time when first SELECT operator executes. Remember, that SQL Server starts transaction at moment of first data access rather than at time of BEGIN TRAN statement.

03. REPEATABLE READ behavior

As you see, with memory-optimized tables, other sessions were able to modify data that was read by active REPEATABLE READ transaction, which led to transaction abort at time of commit. This is completely different behavior from on-disk tables, where other sessions would be blocked until REPEATABLE READ transaction successfully commits.

It is also worth mentioning that in case of memory-optimized tables, REPEATABLE READ isolation level protects you from Phantom Read phenomenon, which is not the case with on-disk tables.

As the next step, let’s repeat our tests in SERIALIZABLE isolation level. You can see a code and results of the execution in Figure 4.

04. SERIALIZABLE behavior

As you see, SERIALIZABLE isolation level prevents session to commit transaction when another session inserted a new row and violate serializable validation. Similar to REPEATABLE READ isolation level, this behavior is different from on-disk tables, where SERIALIZABLE transaction would successfully commit blocking other sessions until it is done.

Finally, let’s repeat our tests in SNAPSHOT isolation level. The code and results are shown in Figure 5.

05. SNAPSHOT behavior

SNAPSHOT isolation level works similar to on-disk tables and protects from Non-Repeatable Reads and Phantom Reads phenomenon. As you can guess, it does not need to perform repeatable read and serializable validations at commit stage and, therefore, reduces the load to SQL Server.

Write/write conflicts work the same way regardless of transaction isolation level in in-memory OLTP. SQL Server does not allow transaction to modify a row that has been modified by other uncommitted transactions. Figures 6 and 7  illustrate such behavior. It uses SNAPSHOT isolation level, however behavior does not change in different isolation levels.

06. Write/write conflict (1)

07. Write/write conflict (2)

Now, let’s dive deeper and look what happens under the hood. Figure 8 illustrates lifetime of in-memory OLTP transaction.

08. In-memory OLTP transaction lifetime

At time, when new transaction starts, it generates new TransactionId and obtains current Global Transaction Timestamp value. Global Transaction Timestamp value dictates what version of the rows are visible to the transaction and timestamp value should be in between BeginTs and EndTs for row to be visible. During data modifications, however, transaction analyzes if there are any uncommitted versions of the rows preventing write/write conflicts when multiple sessions modify the same data.

When transaction needs to delete a row, it updates EndTs timestamp with TransactionId value, which also has an indicator that timestamp contains TransactionId rather than Global Transaction Timestamp. Insert operation creates of a new row with BeginTs of TransactionId and EndTs of Infinity. Finally, update operation consists of delete and insert operations internally.

Figure 9 shows the data rows after we created and populated dbo.HKData table. I am omitting hash index structure for simplicity sake.

09. Data rows after table creation

Let’s assume that we have transaction started at time when Global Transaction Timestamp value was 10 and TransactionId generated as -5. I am using negative value for TransactionId to illustrate a difference between two values in the figures below.

Let’s assume that transaction performs a few data modification operations as shown below.

insert into dbo.HKData with (snapshot)
(ID, Col)
values(10,10);

update dbo.HKData with (snapshot)
set Col = -2
where ID = 2;

delete from dbo.HKData with (snapshot)
where ID = 4;

Figure 10 illustrates the state of a data after data modifications. INSERT statement created a new row, DELETE statement updated EndTs value in the row with ID=4 and UPDATE statement changed EndTs value of the row with ID=2 and created a new version of a row with same ID.

It is important to mention that transaction maintains a write set – pointers to rows that have been inserted and deleted by transaction. Moreover, in SERIALIZABLE and REPEATABLE READ isolation levels, transactions maintains read set of the rows that were read by a transaction. Write set is used to generate transaction log records, while read set is used to perform REPEATABLE READ and SERIALIZABLE rules validation.

10. Data Rows after update (transaction is active)

When COMMIT request is issued, transaction starts validation phase. First, it generates new Global Transaction Timestamp value and replaces TransactionId with this value in all BeginTs and EndTs timestamps in the rows it modified. Figure 11 illustrates that, assuming that Global Transaction Timestamp value is 11.

11. Committing transaction (pre-commit stage)

At this moment, rows modified by transactions become visible to other transactions in the system even though transaction has yet to be committed. Other transactions can see uncommitted rows, which leads to the situation called commit dependency. Those transactions would not be blocked at time when they access those rows, however they would not return data to clients nor commit until original transaction they have commit dependency on would commit itself. If, for some reason, that transaction failed to commit, other dependent transactions would be rolled back and error would be generated.

Commit dependency is technically a case of blocking in in-memory OLTP. However, validation and commit phases of transactions are relatively short and that blocking should not be excessive.

After timestamps in rows were replaced, transaction validates REPEATABLE READ and SERIALIZABLE rules and waits for commit dependencies to clear. When it is done, transaction moves to commit phase, generate one or more log records, save them to transaction log and complete the transaction.

Obviously, validation phase of transactions in REPEATABLE READ and SERIALIZABLE isolation levels is longer than in SNAPSHOT isolation level due to rules validation. Do not use them unless you have legitimate use-case for such data consistency. To be frank, I do not see much use-cases for them besides importing and exporting data to/from in-memory tables.

Locking in Microsoft SQL Server (Part 18) – Key lookup deadlock

Today I would like us to talk about the special case of the deadlock called key lookup deadlock. This deadlock can happen when multiple sessions are reading and updating the same rows simultaneously. Let us look at the example.

As the first step, let us create the table with the clustered and nonclustered indexes. Nonclustered index has one included column. We are inserting 256 rows there keeping clustered and nonclustered key values the same – from 1 to 256.

Creating the table and populating it with the data

Now let us run two sessions in parallel. In the first session, we are updating the column that included to the nonclustered index using clustered key value in where clause.

Session 1 code

As we can guess, this session will use clustered index seek operation in the execution plan.

Session 1 execution plan

The second session will read the same row using nonclustered key value

Session 2 code

Because Col1 is not part of the nonclustered index, we would have nonclustered index seek and key lookup operations in the execution plan:

Session 2 execution plan

Both statements are running in the loop just to emulate concurrent access to the data. In just a few seconds, we will have the deadlock and session with select would be chosen as the deadlock victim.

Deadlock error

At the first glance, this looks confusing. Both sessions are dealing with the same row. We would expect to have the blocking cases due to exclusive (X) and shared (S) lock incompatibility for the duration of the transaction although we do not expect the deadlock. However, even if we are dealing with the single row, there are two indexes involved.

Let us take a look what locks SQL Server acquires when the table has the multiple indexes. First, let us update the column, which does not belong to nonclustered index, and see what row-level locks will be held.

Updating column that is not part of the nonclustered index

As we see, there is only one exclusive (X) lock on the clustered index. Col1 is not part of nonclustered index and as result, SQL Server does not need to update it and acquire the lock there.

Let us see what happen, if we update the column, which is included to the nonclustered index.

Updating column that is included to the nonclustered index

As we see, now we have two locks in place – one on each index key. And the point here is that we run such update, SQL Server would lock the row in one index first and another index after that. The sequence depends on the execution plan and in our case it would acquire exclusive (X) lock on the clustered index first.

Similarly, our select statement also acquires two shared (S) locks. First, it would lock the row in non-clustered index and then acquire the lock on the clustered index during key lookup operation.

That should give us the idea why we have the deadlock. Both statements are running simultaneously. In the first step, update statement acquires exclusive (X) lock on the row in the clustered index and select statement acquires shared (S) lock on the row in the nonclustered index

Key lookup deadlock: Step 1

After that, update statement is trying to acquire the exclusive (X) lock on the nonclustered index row and being blocked because there is the shared (S) lock held. Same thing happens with select statement, which is trying to acquire shared (S) lock on the clustered index row and being blocked because of the exclusive (X) lock held. Classic deadlock.

Key lookup deadlock: Step 2

To prove that, we can run the statement that shows the current row-level locks immediately after we run our original two sessions. If we are lucky, we can catch the state when both sessions are blocked before deadlock monitor task wakes up and terminate one of the sessions.

Row-level locks in time of the deadlock

There are a few ways that can help to eliminate the deadlock. First option would be eliminating key lookup operation by adding Col1 as included column to the index. In such case, select statement does not need to access the data from the clustered index, which will solve the problem. Unfortunately, that solution increases the size of the nonclustered index key row and introduce additional overhead during data modifications and index maintenance.

Another approach would be switching to optimistic isolation levels where writers do not block readers. While it can help to solve blocking and deadlocking issues, it would also introduce additional tempdb overhead and increases the fragmentation.

Finally, we can refactor the code and separate nonclustered index seek and key lookup operations to two separate selects

Workaround: separating NCI seek and key lookup

Workaround: Execution plan

Both select statements are working on the single index scope and as result would not hold shared (S) locks on the both indexes simultaneously when we are using read committed transaction isolation level. Although, this solution would not work in repeatable read and serializable isolation levels where shared (S) locks held until the end of the transaction.

Source code is available for download

Next: Concurrency model in in-memory OLTP (Hekaton)

Table of content

Locking in Microsoft SQL Server (Part 17) – Implementing Critical Section / Mutexes in T-SQL

Today I’d like us to discuss how we can implement analog of Critical Section (or Mutex) in T-SQL. One of the tasks when it could be beneficial is when we need to prevent the multiple sessions from reading the data simultaneously. As the example let’s think about the system which collects some data and does some kind of post processing after data is inserted.

One of the typical implementation in such architecture would be having the farm of the application servers that do the post processing. We usually need to have more than one server in such scenario for scalability and redundancy reasons. The key problem here is how to prevent the different servers from reading and processing the same data simultaneously. There are a few ways how we can do it. One approach would be using central management server that loads and distributes the data across processing servers. While it could help with the scalability we will need to do something to make that server redundant. Alternatively we can use some sort of distributed cache solution. We could load the data there and every server grabs and processes the data from the cache. That approach could be scalable and work great although distributed cache is not the easy thing to implement. There are the few (expensive) solutions on the market though if you don’t mind to spend money.

There are of course, other possibilities but perhaps the easiest approach from the coding standpoint would be implementing application servers in the stateless manner and do the serialization while reading the data in T-SQL.

Let’s create the table we can use in our exercises and populate it with some data.

A couple things here. First of all, we need to handle the situations when application server crashes and make sure that data would be loaded again after some time by another app server. This is a reason why we are using ReadForProcessing datetime column rather than the simple Boolean flag.

I’d also assume that system wants to read data in FIFO (first in, first out) order as much as possible and after processing is done the data would be moved into another table and deleted from the original RawData table. This is the reason why there is no indexes but clustered primary key. If we need to keep the data in the same table we can do it with additional Boolean flag, for example Processed bit column, although we will need to have another index. Perhaps:

create nonclustered index IDX_RawData_ReadForProcessing
on dbo.RawData(ReadForProcessing)
include(Processed)
where Processed = 0

In addition to the index we also need to assign default value to ReadForProcessing column to avoid ISNULL predicate in the where clause to make it SARGable. We can use some value from the past. 2001-01-01 would work just fine.

In either case, after we read the data for the processing we need to update ReadyForProcessing column with the current (UTC) time. The code itself could look like that:

DataPacket CTE is using ordered clustered index scan. It would stop scanning immediately after read 10 rows (TOP condition). Again, we are assuming that data is moved to another table after the processing so it would be efficient. We are updating the timestamp same time when we read it and saving the package for the client in the temporary table @Result using output clause

The problem here is the race condition when two or more sessions are starting to read and update the data simultaneously. Our update statement would obtain shared (S) locks during select in CTE and after that use update (U) and exclusive (X) locks on the data to be updated.

Obviously different sessions would not be able to update the same rows simultaneously – one session will hold exclusive (X) lock on the row while other sessions would be blocked waiting for shared (S) or update (U) lock. In the first case (shared (S) lock), it’s not a problem – the blocked session will read new (updated) value of ReadForProcessing column as soon as the first session releases the exclusive (X) lock. But in the second case the second session will update (and read) the row the second time. Simplified version of the process is shown below.

At the first step both sessions read the row acquiring and releasing shared (S) locks. Both sessions evaluate the predicate (isnull(ReadForProcessing,’2001-01-01′) < dateadd(minute,-1,GetUtcDate())) and decided to update the row. At this point one of the sessions acquires update(U) and then exclusive (X) lock while other session is blocked.

After the first session releases the exclusive (X) lock, the second session updates the same row.

How can we avoid that? We can create another resource and acquire exclusive lock on that resource before update statement from within the transaction. As we remember, exclusive (X) locks held till the end of transaction, so we will use it as the serialization point. Let’s take a look how it works by creating another table as the lock resource. Now, if we start transaction, we can obtain exclusive table lock. Again, exclusive (X) locks held till the end of transaction, so other sessions would be blocked trying to acquire the lock on the table. As result, execution of our update statement would be serialized.

We can test that approach by running this SP from the multiple sessions simultaneously. There is the artificial delay which we are using during the testing just to make sure that we have enough time to run SP in the different session.

While that approach works, there is another, better way to accomplish the same task. We can use application locks. Basically, application locks are just the “named” locks we can issue. We can use them instead of locking table.

That would lead to the same results.

Application locks are also very useful when we need to implement some code that alters the database schema (for example alter partition function) in the systems that are running under load all the time (24×7). Our DDL statements can issue shared application locks while DDL statements acquire exclusive application locks. This would help to avoid deadlocks related to the lock partitioning. You can see the post about lock partitioning with more details about the problem and implementation.

Although, if we talk about specific task of serialization of the reading process, we don’t need critical section at all. We can use the locking hints instead.

As you can see, there are two locking hints in the select statement. UPDLOCK hint forces SQL Server using update (U) locks rather than shared (S) ones. Update locks are incompatible with each other so multiple sessions would not be able to read the same row. Another hint – READPAST – tells SQL Server to skip the locked rows rather than being blocked. Let’s modify our stored procedure to use that approach.

I’m adding some code to the procedure to emulate race condition. In one session we will run the stored procedure with @UseDelay = 1. In another with @UseDelay = 0. Both of those sessions will start to execute the main update statement roughly at the same time.

This method works even more efficiently than the “critical section” approach. Multiple sessions can read the data in parallel.

Well, I hope that we achieved two goals today. First – we learned how to implement critical section and/or mutexes in T-SQL. But, more importantly, I hope that it taught us that in some cases, the “classic” approach is not the best and we need to think out of the box. Even when this thinking involved the standard functional available in SQL Server.

Source code is available for download

Table of content

Next: Key lookup deadlock


Locking in Microsoft SQL Server (Part 16) – Monitoring Blocked Processes Report with Event Notifications

UPDATE 2018-08-01: New and redesigned version of the code is available here

As we already know it’s very easy to capture blocked process report by using SQL Traces. That method though has a few limitations. First of all, it means we need to have SQL Trace up and running all the time. And SQL Trace, especially the client one, introduces the overhead on SQL Server. Another big problem is that we need to monitor traces on the regular basis. And in case if we had the blocking from within the stored procedures (e.g. session input buffer contains SP reference only), we would need to use sql handles and get the estimate execution plan from the plan cache. Nothing guarantees that plan would be there by the time when we start troubleshooting the blocking problem. Of course, we can set up an alert with SQL Agent and get the notification when blocking
occurs although it would still mean that we have to do our job manually.

As another option we can use Event Notification for BLOCKED_PROCESS_REPORT event. This approach would utilize Service Broker so we would be able to create activation stored procedure and parse blocking report there. Let’s take a look at that.

First of all, we need to decide where to store the data. While we can put the table to the user database, I’d prefer to use separate utility database for the data collection. Let’s do that:

At that point we would have blocked process report events going to dbo.BlockedProcessNotificationQueue service broker queue. Assuming, of course, that we have blocked process threshold option set.

Obviously we do not want to have those messages sitting in the queue – it’s kind of defeating the purpose of having the process automated. What I would like to do at this point is shredding event data and putting it to the table for analysis. Another important factor is that blocked process monitor would generate separate events for the same blocking condition every time it wakes up. For example, if we have blocking process threshold set to 5 seconds, we can get five events until our query times out after 30 seconds. Ideally I’d like to combine those events into the single one to have analysis simplified. So let’s create the table to store the data.

This table stores the information about both – blocked and blocking processes. Although blocking information can be misleading in case if blocking session currently executes the different batch or even waiting for the next batch to be executed – table would store the current state rather than info at the time when blocking occurs. In any cases, from the blocking process standpoint the most interesting attributes are:

  1. Process Status – is it running, sleeping or suspended? If it’s sleeping, it could be the sign that client does not work with transations correctly – either did not commit one of the nested transactions or, perhaps, mixed them with UI activity. Suspended status could be the sign of the blocking chain which is another story
  2. TranCount – if it’s more than one, it would tell us that we have nested transactions and again, perhaps, client does not handle them correctly.

In any case, we will have full report stored and can access it if needed. And of course, we can modify the table and add extra attributes if we want to.

Now it’s the time to put the activation procedure in place. I’m going to cheat a little bit here – click at the link to the source code at the end of the post to see it.

There are two things I’d like to mention though. First one is how we get the query plans.  For the blocked process we are trying to get it from sys.dm_exec_requests first. This is the only bullet-proof way to get the real plan but it would work only if the statement is still blocked when activation SP executes. If this is not the case we are using sys.dm_exec_query_stats DMV. There are a couple challenges though. First, there is the chance that plan would not be there – for example in case of the memory pressure. Alternatively we have the situation when there are multiple plans due recompilation. We are trying to guess the right one by filtering based on the blocking time but that method is not always working. So no guarantees. For the blocking process we are always using sys.dm_exec_query_stats picking up the top (random) plan.

Another thing is how we are looking up if there are other events for the same blocking. Basically stored procedure is trying to match various columns in the merge statement – perhaps even more than needed – but in either case I’d rather have duplicate records than incorrect information.

Last step we need to do is setting up the security. That step is kind of optional in case if we are storing the data in the user database but in our case, when we create the blank database and set up everything under “dbo” user it’s required. When Service Broker activates the stored procedure under that security context (EXECUTE AS OWNER), dbo has enough rights to deal with the database object. But that user also needs to have the rights to query system DMV. As result, we need to create the certificate in the both, EventMonitoring and master databases, create the login from the certificate, grant this login “view server state” and “authenticate server” rights and finally sign the stored procedure with the certificate. Or, perhaps, mark the database as Trustworthy 🙂

And now it’s time for the testing. Let’s create the small table and populate it with a few records.

Next, let’s place exclusive (X) lock on one of the rows in the first session.

In another session let’s introduce the table scan in read committed isolation level.

If we query the service broker queue we would see that there are a few events there. Our queue does not have automatic activation yet.

And finally let’s alter the queue to enable the activation.

Next, let’s query the table.

As we can see, there is the single record in the table now – exactly what we need. This approach is, of course, customizable. You can collect other statistics by changing the implementation. Hope, that script would be the great starting point

Next: Implementing Critical Sections / Mutexes in T-SQL

Table of content


Locking in Microsoft SQL Server (Table of Content)

Just to make it simpler to navigate:

Additional: