Tag Archives: Blocking Processes

Blocking Monitoring Framework: Capture and Analyze SQL Server Blocking and Deadlock Information With Event Notifications

If you worked with SQL Server for a while, you should have noticed how landscape changed over the years. We are dealing with the different problems now. Five years ago, majority of the issues I saw were related to non-optimized queries. There were the huge scans with a lot of  physical I/O and bad performance.

You do not see them as often nowadays. It is very cheap to solve the problems by upgrading the server. Put a couple hundred GBs of RAM and cache all the data; add more CPUs and problems magically disappear. The root-cause has not been fixed but who cares?

Surprisingly, there is one category of the issues that did not went away – concurrency. It even becomes worse. Modern servers handle more users and problems that did not exist with 50 concurrent users may put the server to its knees with 5000 users. I’ve been constantly involved in the troubleshooting of various concurrency issues and, in fact, I see more and more of them overtime.

Troubleshooting of the blocking and concurrency issues is, in the nutshells, a simple process. You need to identify the processes involved in blocking conditions or deadlocks and analyze why those processes acquire the locks on the same resources. In majority of cases, you need to analyze queries and their execution plans identifying possible inefficiencies that led to excessive number of locks being acquired.

Collecting this information is not a trivial task. The information is exposed through DMVs (you can download the set of scripts here); however, it requires you to run the queries at time when blocking occurred. Fortunately, SQL Server allows you to capture blocking and deadlock conditions with the blocked process report and deadlock graph, analyzing them later.

There is the caveat though. Neither blocked process report nor deadlock graph provide you execution plans of the statements. Nor do they always include affected statements in the plain text. You may need to query plan cache and other DMVs to get this information and longer you wait lesser is the chance that the information is available. Moreover, SQL Server may generate enormous number of blocked process reports in cases of prolonged blocking and complex blocking chains, which complicates the analysis.

This analysis may become very time consuming, especially if you need to deal with the large number of servers. Over the years, I have created the set of routines, which simplify it for me. I have been thinking to publish my scripts for a while, but I’ve never had time to polish them enough for public consumption. Until now – and I am very happy to share my collection with all of you. So allow me introduce the Blocking Monitoring Framework, which I am using with majority of my servers!

This framework is using Event Notifications. It captures blocked process report and deadlock graphs and parses them at time when event occurred and all data is still available in the system. All information is persisted in the set of tables for the further analysis.

The first version is available for download. I also promise you that I am going to support and enhance it in the future publishing the new versions on the regular basis.

Please feel free to contact me in case of any questions. I would also appreciate if you provide me any blocked process reports and deadlock graphs that framework was unable to parse. I will address the issues as quickly as I could.

Blocking Monitoring Framework

Locking in Microsoft SQL Server (Part 20) – Range lock (RangeS-U) deadlock due to IGNORE_DUP_KEY index option

As you know, SQL Server uses range locks to protect the range of the index keys. This usually happens in SERIALIZABLE isolation level. This level prevents phantom and non-repeatable reads phenomena and it guarantees that queries executed in transaction will always obtain the same set of data every time they were executed.

As the simple example, consider the table with ID column and two rows with ID = 1 and ID = 10. In SERIALIZABLE isolation level, the query that selects data from the table should always obtain those and only those two rows if you run it multiple times. SQL Server uses shared range lock protecting ID key range interval of (1..10), which guarantees that other transactions would not be able to update or delete existing rows nor insert any new rows into the interval.

In contrast, REPEATABLE READ isolation level uses row locks rather than range locks. They would prevent modifications of existing rows- 1 and 10- but would not prevent other transactions from inserting rows into the interval and introducing phantom read phenomena.

The range locks are usually acquired only in SERIALIZABLE isolation level; however, there is another, pretty much undocumented case, when SQL Server can use those locks. It happens even in READ UNCOMMITTED and READ COMMITTED SNAPSHOT modes when you have nonclustered indexes that have IGNORE_DUP_KEY=ON option. In that case rows with the duplicated index keys would not raise an error but rather being ignored. SQL Server would not insert then into the table.

This behavior leads to very hard to explain cases of blocking and even deadlocks in the system. Let’s look at the example and create the table with a few rows as shown below. As you see, nonclustered index on the table has IGNORE_DUP_KEY option enabled.

create table dbo.IgnoreDupKeysDeadlock
(
    CICol int not null,
    NCICol int not null
);

create unique clustered index IDX_IgnoreDupKeysDeadlock_CICol
on dbo.IgnoreDupKeysDeadlock(CICol);

create unique nonclustered index IDX_IgnoreDupKeysDeadlock_NCICol
on dbo.IgnoreDupKeysDeadlock(NCICol)
with (ignore_dup_key = on);

insert into dbo.IgnoreDupKeysDeadlock(CICol, NCICol)
values(0,0),(5,5),(10,10),(20,20);

Now let’s start transaction in READ UNCOMMITTED mode and insert the row into the table checking the locks session acquired.

set transaction isolation level read uncommitted
begin tran
    insert into dbo.IgnoreDupKeysDeadlock(CICol,NCICol) values(1,1);

    select request_session_id, resource_type, resource_description
        ,resource_associated_entity_id, request_mode, request_type, request_status
    from sys.dm_tran_locks
    where request_session_id = @SPID;

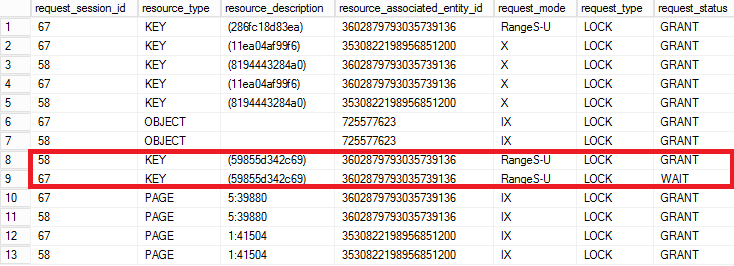
As you can see in Figure 1, INSERT statement acquired and held two exclusive (X) locks on the rows inserted into clustered and nonclustered indexes. It also obtained Range (RangeS-U) lock on nonclustered index. RangeS-U means that the key range is protected with the shared (S) lock and SQL Server uses update (U) scan within the range.

01. Locks Held by the Session

01. Locks Held by the Session

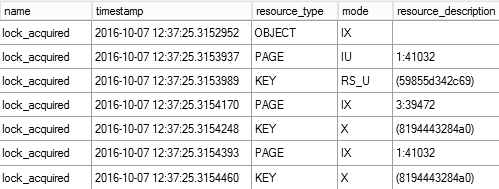
You may ask the obvious question – why the range lock is required? The reason is the way how SQL Server handles modifications of the data. The data is always inserted into or updated in the clustered index first followed by nonclustered index updates. With IGNORE_DUP_KEY=ON, SQL Server should prevent the situation when the duplicated keys were inserted into nonclustered index simultaneously after clustered index insert was done and, therefore, clustered index insert needs to be rolled back. Thus, it locks nonclustered index key range before any data modifications preventing other sessions from inserting any rows there.

You can confirm it by looking at lock_acquired xEvent events as it is show in Figure 2. As you can see, the RangeS-U lock is acquired before exclusive (X) locks on the resources.

02. lock_acquired Events During Insert

02. lock_acquired Events During Insert

The key problem here, however, is that RangeS-U lock behaves the same way as in SERIALIZABLE isolation level and it is held until the end of transaction. Moreover,  RangeS-U locks are incompatible with each other.  That can lead to very unpleasant and hard to understand deadlocks.

Let’s run the code shown below in another session. The first INSERT would succeed (it is in the different key range in the index). The second, however, would be blocked due to RangeS-U/RangeS-U lock incompatibility.

set transaction isolation level read uncommitted
begin tran
    -- Succeed
    insert into dbo.IgnoreDupKeysDeadlock(CICol,NCICol)	values(12,12);
    -- Blocked
    insert into dbo.IgnoreDupKeysDeadlock(CICol,NCICol) values(2,2);
commit

If we checked the locks held by the both sessions now, we would see the picture shown in Figure 3. You can see that session 2 successfully acquired the first range lock but the second range lock request is blocked due to incompatible range lock on the same key interval held by the session 1.

03. Locks Held by Both Sessions

03. Locks Held by Both Sessions

Finally, if we run another INSERT in the session 1 into the range locked by the session 2, it would be also blocked with the typical deadlock condition.

    insert into dbo.IgnoreDupKeysDeadlock(CICol,NCICol) values(11,11);
commit

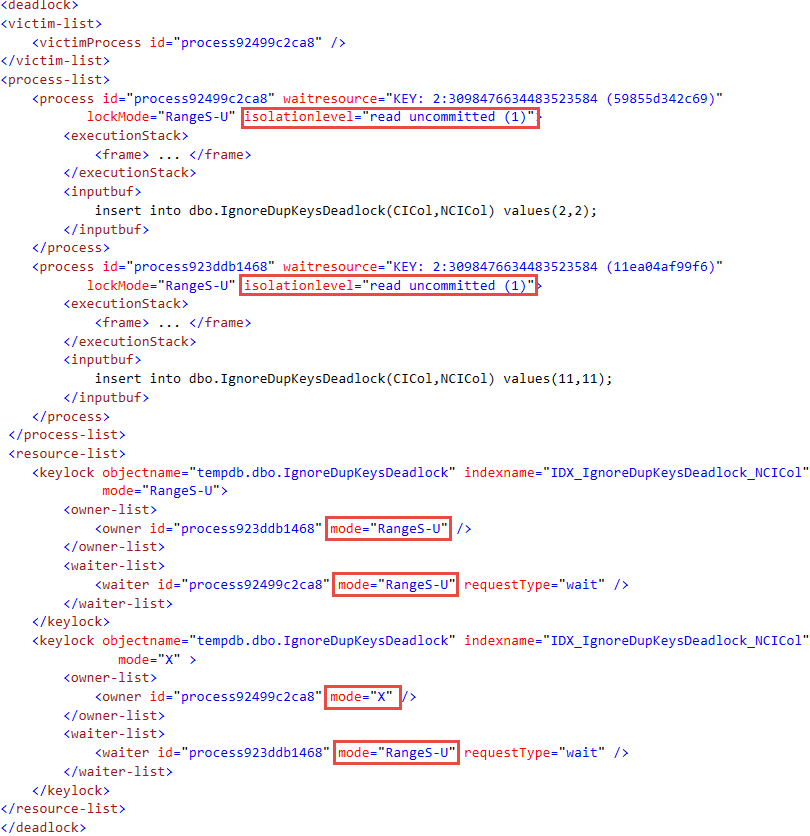
Figure 4 shows you the deadlock graph.

04. Deadlock Graph

04. Deadlock Graph

Unfortunately, there is very little you can do about that. The only way to address the problem is removing IGNORE_DUP_KEY option from the index handling duplicates in the different ways. It may or may not work for you.

Finally, it is worth mentioning, that SQL Server does not use range locks in case of clustered indexes with IGNORE_DUP_KEY=ON option. Clustered indexes are modified first and SQL Server could detect duplicated keys at this stage without any extra range locking required.

Source code is available for download.

Table of Content.

Locking in Microsoft SQL Server (Part 16) – Monitoring Blocked Processes Report with Event Notifications

UPDATE 2018-08-01: New and redesigned version of the code is available here

As we already know it’s very easy to capture blocked process report by using SQL Traces. That method though has a few limitations. First of all, it means we need to have SQL Trace up and running all the time. And SQL Trace, especially the client one, introduces the overhead on SQL Server. Another big problem is that we need to monitor traces on the regular basis. And in case if we had the blocking from within the stored procedures (e.g. session input buffer contains SP reference only), we would need to use sql handles and get the estimate execution plan from the plan cache. Nothing guarantees that plan would be there by the time when we start troubleshooting the blocking problem. Of course, we can set up an alert with SQL Agent and get the notification when blocking
occurs although it would still mean that we have to do our job manually.

As another option we can use Event Notification for BLOCKED_PROCESS_REPORT event. This approach would utilize Service Broker so we would be able to create activation stored procedure and parse blocking report there. Let’s take a look at that.

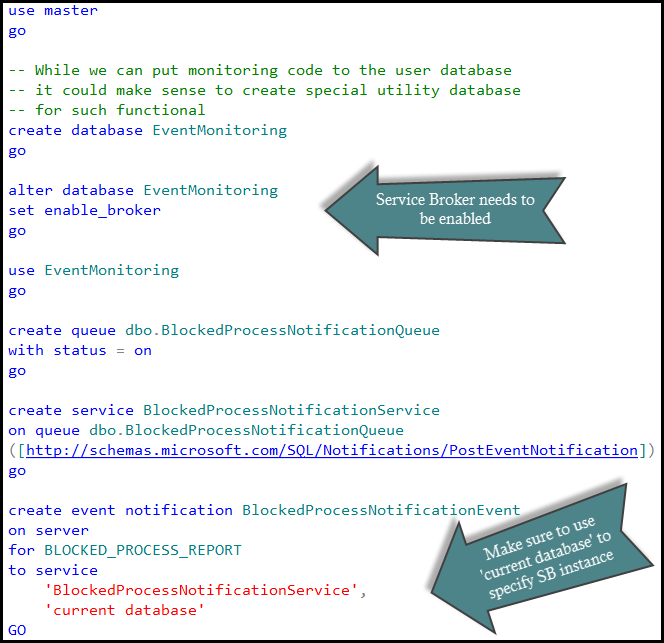
First of all, we need to decide where to store the data. While we can put the table to the user database, I’d prefer to use separate utility database for the data collection. Let’s do that:

At that point we would have blocked process report events going to dbo.BlockedProcessNotificationQueue service broker queue. Assuming, of course, that we have blocked process threshold option set.

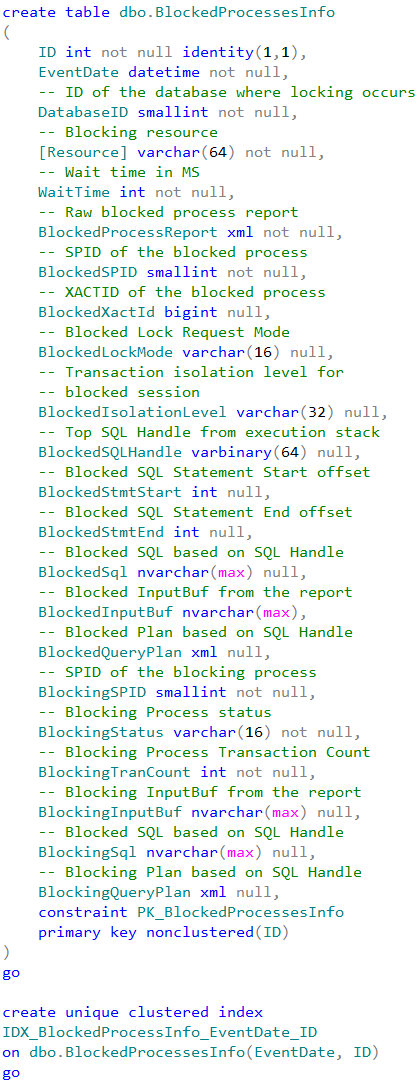
Obviously we do not want to have those messages sitting in the queue – it’s kind of defeating the purpose of having the process automated. What I would like to do at this point is shredding event data and putting it to the table for analysis. Another important factor is that blocked process monitor would generate separate events for the same blocking condition every time it wakes up. For example, if we have blocking process threshold set to 5 seconds, we can get five events until our query times out after 30 seconds. Ideally I’d like to combine those events into the single one to have analysis simplified. So let’s create the table to store the data.

This table stores the information about both – blocked and blocking processes. Although blocking information can be misleading in case if blocking session currently executes the different batch or even waiting for the next batch to be executed – table would store the current state rather than info at the time when blocking occurs. In any cases, from the blocking process standpoint the most interesting attributes are:

  1. Process Status – is it running, sleeping or suspended? If it’s sleeping, it could be the sign that client does not work with transations correctly – either did not commit one of the nested transactions or, perhaps, mixed them with UI activity. Suspended status could be the sign of the blocking chain which is another story
  2. TranCount – if it’s more than one, it would tell us that we have nested transactions and again, perhaps, client does not handle them correctly.

In any case, we will have full report stored and can access it if needed. And of course, we can modify the table and add extra attributes if we want to.

Now it’s the time to put the activation procedure in place. I’m going to cheat a little bit here – click at the link to the source code at the end of the post to see it.

There are two things I’d like to mention though. First one is how we get the query plans.  For the blocked process we are trying to get it from sys.dm_exec_requests first. This is the only bullet-proof way to get the real plan but it would work only if the statement is still blocked when activation SP executes. If this is not the case we are using sys.dm_exec_query_stats DMV. There are a couple challenges though. First, there is the chance that plan would not be there – for example in case of the memory pressure. Alternatively we have the situation when there are multiple plans due recompilation. We are trying to guess the right one by filtering based on the blocking time but that method is not always working. So no guarantees. For the blocking process we are always using sys.dm_exec_query_stats picking up the top (random) plan.

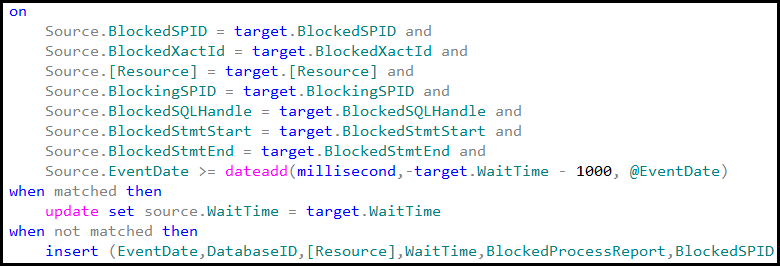
Another thing is how we are looking up if there are other events for the same blocking. Basically stored procedure is trying to match various columns in the merge statement – perhaps even more than needed – but in either case I’d rather have duplicate records than incorrect information.

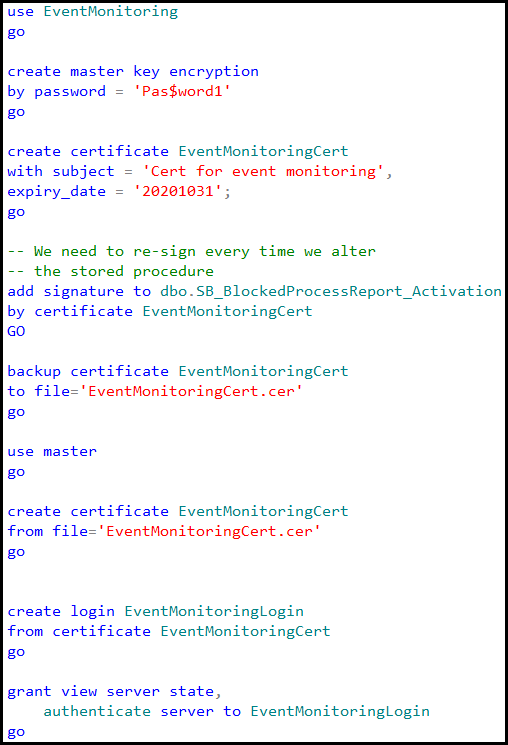
Last step we need to do is setting up the security. That step is kind of optional in case if we are storing the data in the user database but in our case, when we create the blank database and set up everything under “dbo” user it’s required. When Service Broker activates the stored procedure under that security context (EXECUTE AS OWNER), dbo has enough rights to deal with the database object. But that user also needs to have the rights to query system DMV. As result, we need to create the certificate in the both, EventMonitoring and master databases, create the login from the certificate, grant this login “view server state” and “authenticate server” rights and finally sign the stored procedure with the certificate. Or, perhaps, mark the database as Trustworthy 🙂

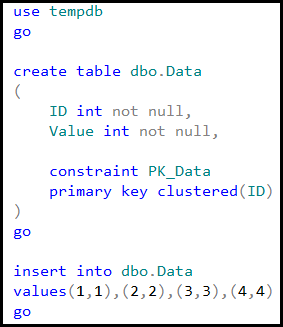
And now it’s time for the testing. Let’s create the small table and populate it with a few records.

Next, let’s place exclusive (X) lock on one of the rows in the first session.

In another session let’s introduce the table scan in read committed isolation level.

If we query the service broker queue we would see that there are a few events there. Our queue does not have automatic activation yet.

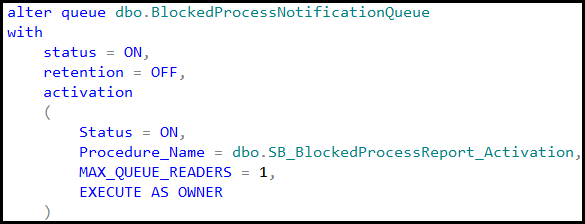
And finally let’s alter the queue to enable the activation.

Next, let’s query the table.

As we can see, there is the single record in the table now – exactly what we need. This approach is, of course, customizable. You can collect other statistics by changing the implementation. Hope, that script would be the great starting point

Next: Implementing Critical Sections / Mutexes in T-SQL

Table of content