The life of Database Engineer is never boring. We are constantly pushing the boundaries and dealing with more complex systems every year. Our challenges are also changing over time. Our current problems did not even exist 5 years ago. New and powerful hardware creates bottlenecks in unexpected areas.
One of such examples is the blocking introduced by AlwaysOn Availability Groups and synchronous commit. This condition may occur with any transaction log-intensive operations, especially on the modern servers with powerful CPUs and fast flash-based storage.
As you know, Availability Groups consist of one primary and one or more secondary nodes/servers. All data modifications are done on the primary node, which sends the stream of t-log records to secondaries. Those log records are saved (hardened) in transaction logs there and asynchronously re-applied to the data files by the set of REDO threads.
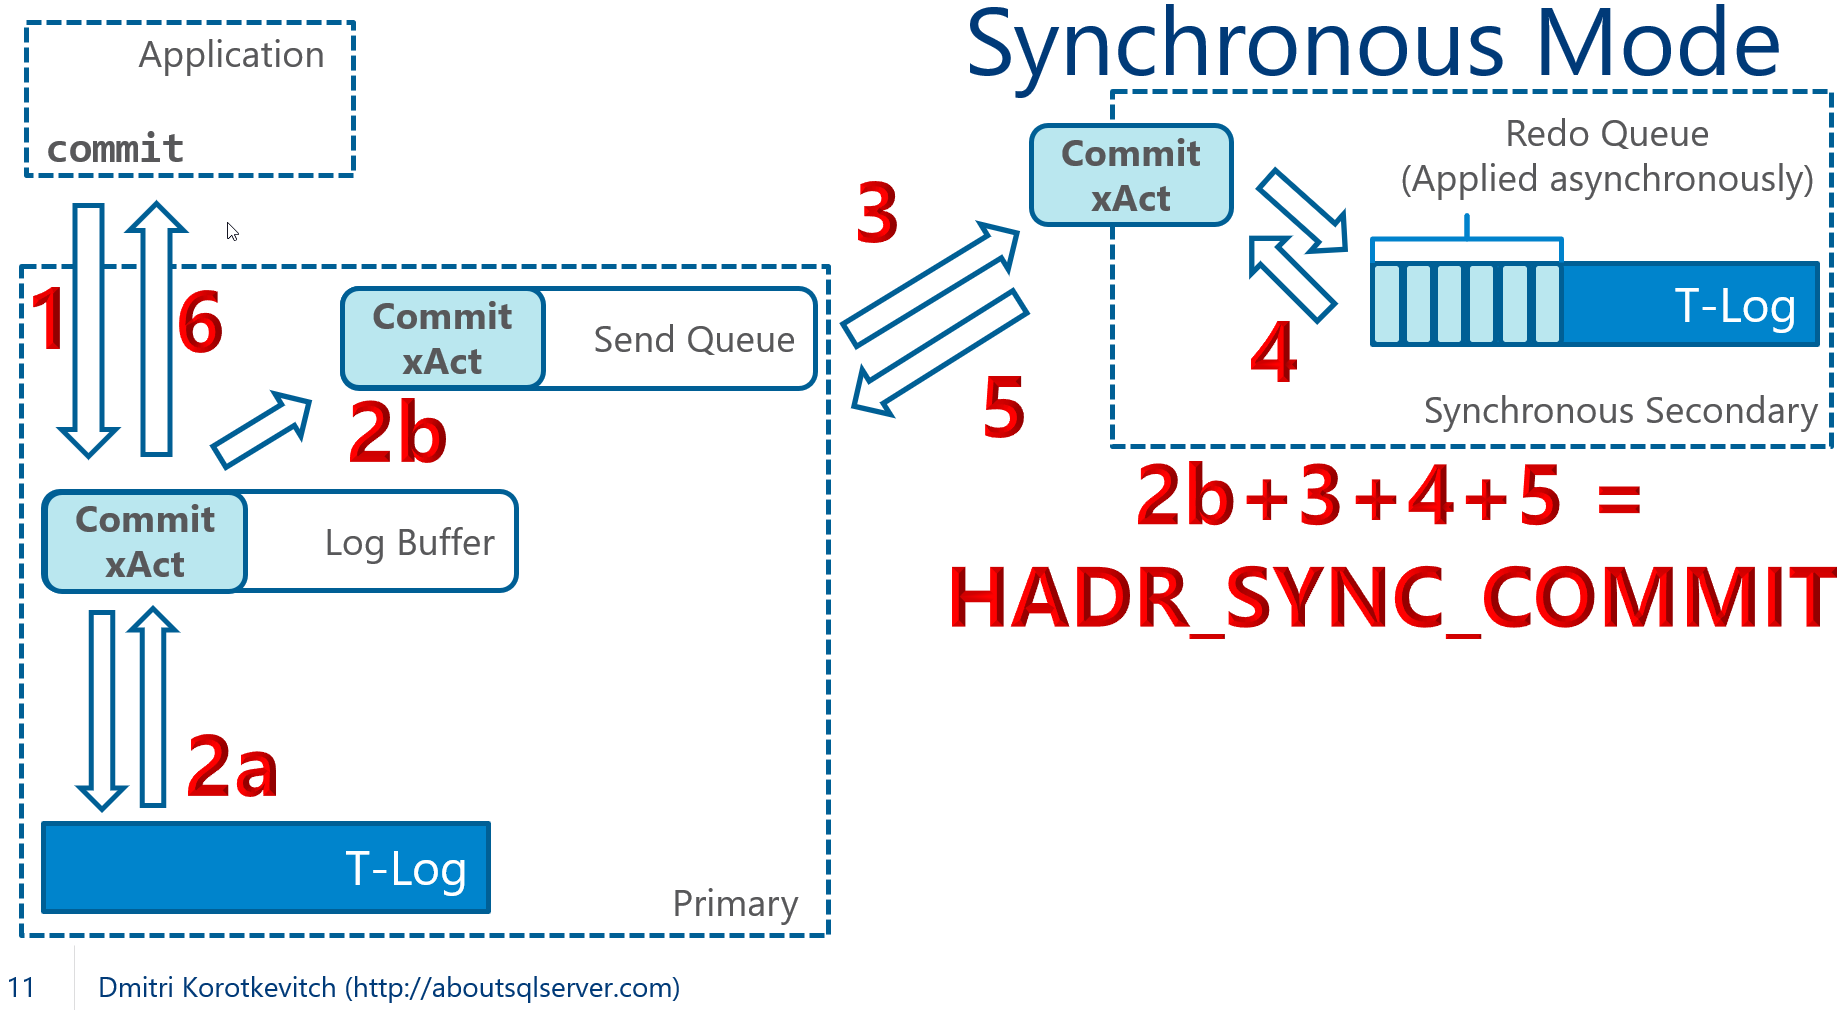
The secondary nodes may be configured using asynchronous or synchronous commit. With asynchronous commit, transaction considered to be committed and all locks were released when COMMIT log record is hardened on the primary node. SQL Server sends COMMIT record to secondary node; however, it does not wait for the confirmation that the record had been hardened in the log there.
This behavior changes when you use synchronous commit as shown in Figure 1. In this mode, SQL Server does not consider transaction to be committed until it receives the confirmation that COMMIT log record is hardened in the log on the secondary node. The transaction on primary will remain active with all locks held in place until this confirmation is received. The session on primary is suspended with HADR_SYNC_COMMIT wait type.

You can analyze impact of commit latency by looking at HADR_SYNC_COMMIT wait in wait statistics. It is not uncommon nowadays to see this wait to be at the top of the list in busy OLTP systems. Figure 2 below illustrates the output from one of my production servers.

While we may argue that the Average Wait Time of 3ms would not introduce noticeable overhead, the situation may quickly change when you run t-log intensive processes that generate large amount of transaction log records. Those processes may quickly saturate the Send queue and dramatically increase HADR_SYNC_COMMIT wait/latency. This will affect all processes and transactions in the system – all of them share the same Send queue.
Unfortunately, index maintenance is one of such processes. Index reorgs and rebuilds may create enormous amount of transaction log records, especially when LOB columns are involved. You can watch the short YouTube video that illustrates how index rebuild operation put the system down in no time.
There are a few things you can try to improve the situation:
- You can throttle index maintenance performance by reducing MAXDOP for the operation. This will reduce log generation rate at cost of increased execution time. Unfortunately, even MAXDOP=1 may not be enough in some cases
- Alternatively, in Enterprise Edition of SQL Server, you can throttle the process with Resource Governor, limiting IOPS and CPU bandwidth. This approach may require good amount of trial and errors to achieve optimal configuration
- In SQL Server 2017 and above, you can utilize resumable index rebuild and build the process which will frequently pause the operation allowing Availability Group queues to catch up. I am not the big fan of this approach; however, it may work when properly implemented.
Unfortunately, even with some tricks, in many cases, you’d still need to switch to asynchronous commit mode during massive index operations. Well, it is the great example that everything in SQL Server fits into “It Depends” category. Even good hardware.
Queue Monitoring
As you can guess, it is essential to monitor Availability Group queues. You need to keep an eye on both, Send and Redo queues.
- In case of synchronous replicas, large Send queue implies potential blocking. With asynchronous replicas, large Send queue dictates potential data loss – data from the queue has not been sent to secondaries.
- Large Redo queue implies long database recovery time in case of failover. All records from the queue need to be applied to the database before it becomes available. Moreover, in case of readable secondaries, large Redo queue indicates that secondary replica may fall behind being out of date.
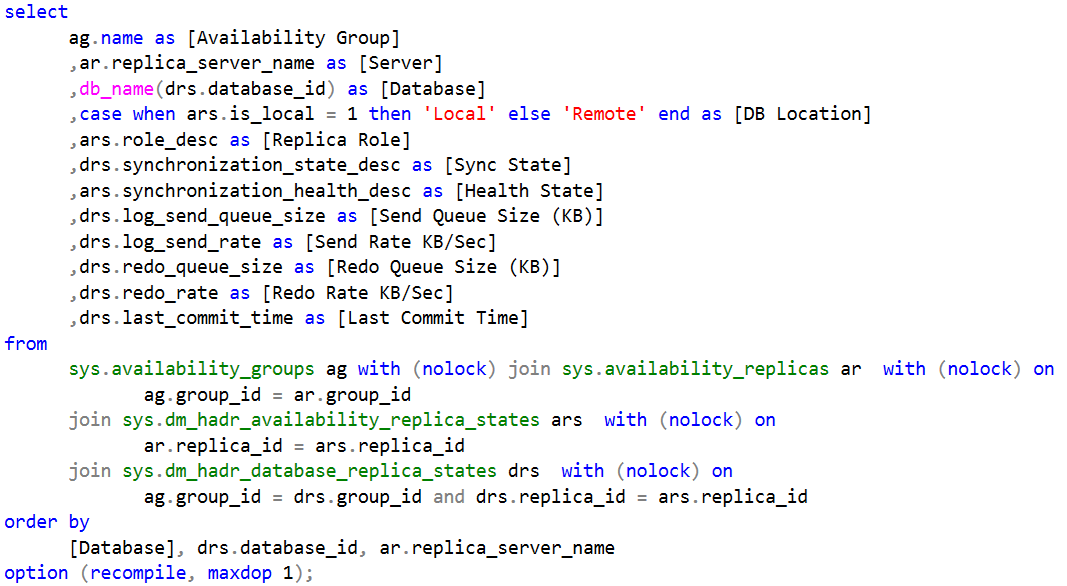
The script below provides you the information about Availability Group health and replication latency along with Send and Redo queues sizes. It is available for download (link is in the end of the post)

I usually run that script from SQL Server job every a few minutes and use it to send alert to the team when Send or Redo queue sizes exceed predefined threshold. Obviously, thresholds may vary based on workload the databases handle.
Addressing High HADR_SYNC_COMMIT waits
I consider HADR_SYNC_COMMIT as the dangerous wait and want to address it when it is noticeable in the wait statistics.
Generally, there are three main factors that contribute to this wait:
- The time, log record waits in the send queue. You can analyze this with the code from Listing 1 using the data from [Send Queue Size(KB)] and [Send Rate KB/Sec] columns. It is worth noting that the queue management process is CPU intensive, which may lead to additional latency in the systems with high CPU load.
- Network throughput. You can troubleshoot it with network-related performance counters along with SQL Server:Availability Replica > Bytes Sent performance counter. Obviously, make sure that your network infrastructure is configured in the optimal way
- I/O latency on secondary nodes. Synchronous commit requires COMMIT log record to be hardened in transaction log before acknowledgement is sent back to the primary node. You can monitor write latency of transaction log file using sys.dm_db_virtual_file_stats view. You can download the script to do it through the link in the end of the blog post.
While network and I/O performance may, sometimes, be addressed by hardware upgrades; it is much harder to deal with the latency, introduced by large amount of log records in very busy OLTP systems. You can reduce the overhead of queue management by utilizing CPUs with higher clock speed; however, there are some limits on what you can achieve with the hardware.
There are several things you can do when you experienced this situation:
- Make sure that SQL Server schedulers are evenly balanced across NUMA nodes. For example, if SQL Server is using 10 cores on 2 NUMA-node server with 8 cores per node, set affinity mask to use 5 cores per node. Unevenly balanced schedules may introduce various performance issues in the system and affect Availability Groups throughput.
- Reduce amount of log records generated in the system. Some of the options are redesigning transaction strategy avoiding autocommitted transactions; removing unused and redundant indexes; fine-tuning index FILLFACTOR property reducing the page splits in the system.
- Rearchitect data tier in the system. It is very common that different data in the system may have different RPO (recovery point objective) requirements and tolerance to the data loss. You may consider to move some data to another Availability Group that does not require synchronous commit and/or utilize NoSQL technologies for some entities.
Finally, if you are using SQL Server prior 2016, you should consider to upgrade to the latest version of the product. SQL Server 2016 has several internal optimizations, which dramatically increase Availability Groups throughput comparing to SQL Server 2012 and 2014. It may be the simplest solution in many cases.
Figure 3 below illustrates HADR_SYNC_COMMIT waits before and after SQL Server 2016 upgrade in one of the systems. As you can see, cumulative time for HADR_SYNC_COMMIT waits had been reduced for more than 3 times after upgrade. It is also worth noting that general system performance had been improved as well.

While having zero data loss is the great thing, remember about synchronous commit overhead. Monitor Availability Groups Queues and HADR_SYNC_COMMIT in the system.
Several useful scripts.
Link to YouTube video with the demo.
PS. I am teaching full day SQL Server Internals class at SQL Saturday #862 in Cork, Ireland on June 28th, 2019. You can register to pre-con here.
Pingback: Dealing with HADR_SYNC_COMMIT Waits – Curated SQL
Excellent article! Thanks, Dmitri. A question which I am hoping you may be able to help – we have AG configured between two replicas (1 primary and 1 secondary) in Async commit mode. Two AGs with one DB (1.5 TB) in each. Due to heavy indexing every night (part of the nightly ETL load), there’s about 600 GB worth of log generated each night. Thanks to the Async commit, there’s no issues on the primary replica. However, there’s huge REDO QUEUE building up on the secondary replica causing latency in secondary catching up with primary. Both secondary DBs share the same drive for T-log files.
This behavior is understandable, given the huge log to replay on secondary. However, my question is, one of the two DBs is pretty quick to catch up and has a higher REDO RATE (~65 MB/sec) than the other DB with a lower REDO RATE (30 mb/sec).
Questions: 1) Do you think sharing the T-logs for both of them on the same drive is contributing to the latency for one of the DBs? The storage is SAN.
2. Is there a way to increase the REDO RATE for the slower DB? or SQL determines it on its own?
-Khan
An avid reader of your books.
Thank you, Khan!
1) Hard to say. In reality a lot of things depend on underlying SAN configuration. Putting files to the different LUNs may not necessarily help if they use the same spindles. Also, don’t forget that REDO performance may depend on the data files throughput. I would look at sys.dm_io_virtual_file_stats and start troubleshooting from there. Look at the latency and amount of data, which files handle.
2) I do not think there is a way. SQL Server does not throttle REDO performance – it tries to apply changes as fast as it could.
Also, if you are on 2016+ it may make sense to experiment with disabling parallel REDO. There is TF to do that – you can disable it online but some builds would not allow you to re-enable it after restart. https://support.microsoft.com/en-us/help/4339858/fix-parallel-redo-does-not-work-after-you-disable-trace-flag-3459-in-a
Thanks for your quick response and apologies for the delay in following up. We don’t see any alarming issue with the data files, and are leaning toward isolating the log file to another drive. The way the SAN admin explained to us made it seem like it’ll help separating out the t-log on to a separate drive. He mentioned the SAN will prioritize the other drive, etc. So we are looking into trying it.
hmm, disabling parallel redo sounds like a nice idea, however, with two huge AG databases to synchronize and redo 600+ GB worth of transaction log each night, I am afraid serial redo may turn out to be counter-productive. The servers are pretty beefy with 72 physical cores and 1.5 TB SQL allocated memory on each replica. So given the enormous resources, I’d imagine parallel redo should outperform serial redo.
Hi Dmitri!
How can I figure out which node is cluster ownership in a cluster?
What is the difference between cluster ownership and other nodes in a cluster?
As you know, the cluster ownership and primary replica are two different things.
Kind regards!