UPDATE 2018-08-01: New and redesigned version of the code is available here
As we already know it’s very easy to capture blocked process report by using SQL Traces. That method though has a few limitations. First of all, it means we need to have SQL Trace up and running all the time. And SQL Trace, especially the client one, introduces the overhead on SQL Server. Another big problem is that we need to monitor traces on the regular basis. And in case if we had the blocking from within the stored procedures (e.g. session input buffer contains SP reference only), we would need to use sql handles and get the estimate execution plan from the plan cache. Nothing guarantees that plan would be there by the time when we start troubleshooting the blocking problem. Of course, we can set up an alert with SQL Agent and get the notification when blocking
occurs although it would still mean that we have to do our job manually.
As another option we can use Event Notification for BLOCKED_PROCESS_REPORT event. This approach would utilize Service Broker so we would be able to create activation stored procedure and parse blocking report there. Let’s take a look at that.
First of all, we need to decide where to store the data. While we can put the table to the user database, I’d prefer to use separate utility database for the data collection. Let’s do that:
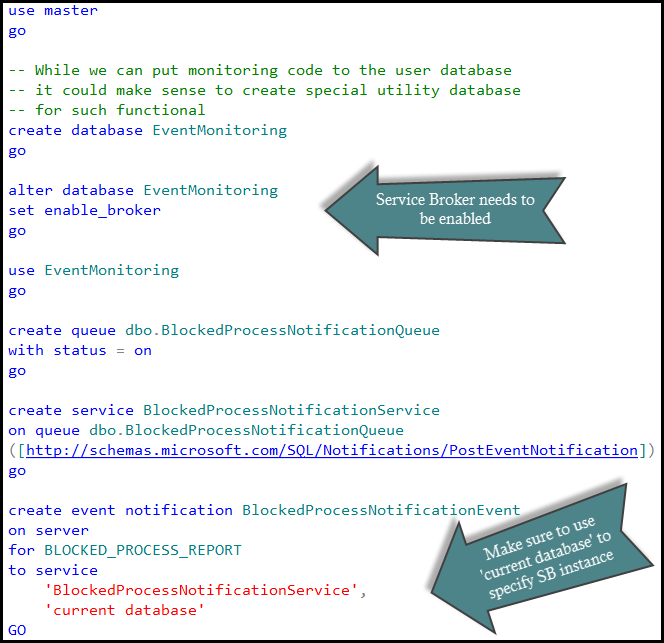
At that point we would have blocked process report events going to dbo.BlockedProcessNotificationQueue service broker queue. Assuming, of course, that we have blocked process threshold option set.

Obviously we do not want to have those messages sitting in the queue – it’s kind of defeating the purpose of having the process automated. What I would like to do at this point is shredding event data and putting it to the table for analysis. Another important factor is that blocked process monitor would generate separate events for the same blocking condition every time it wakes up. For example, if we have blocking process threshold set to 5 seconds, we can get five events until our query times out after 30 seconds. Ideally I’d like to combine those events into the single one to have analysis simplified. So let’s create the table to store the data.
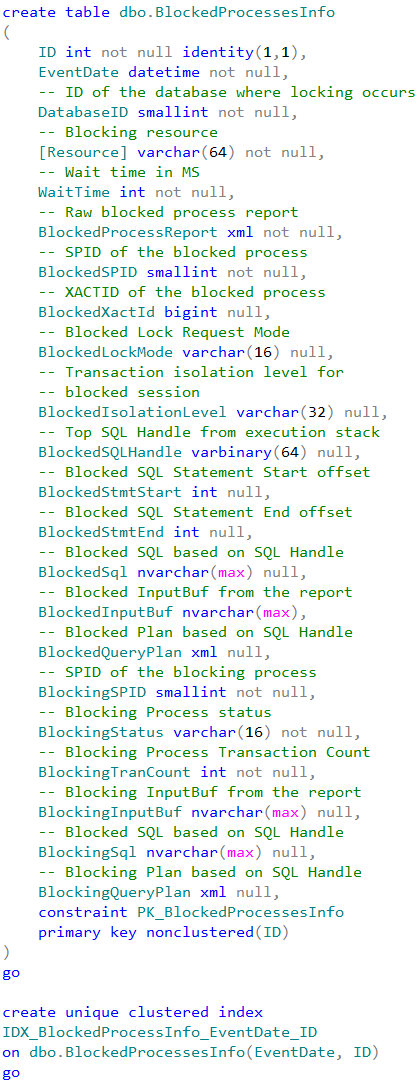
This table stores the information about both – blocked and blocking processes. Although blocking information can be misleading in case if blocking session currently executes the different batch or even waiting for the next batch to be executed – table would store the current state rather than info at the time when blocking occurs. In any cases, from the blocking process standpoint the most interesting attributes are:
- Process Status – is it running, sleeping or suspended? If it’s sleeping, it could be the sign that client does not work with transations correctly – either did not commit one of the nested transactions or, perhaps, mixed them with UI activity. Suspended status could be the sign of the blocking chain which is another story
- TranCount – if it’s more than one, it would tell us that we have nested transactions and again, perhaps, client does not handle them correctly.
In any case, we will have full report stored and can access it if needed. And of course, we can modify the table and add extra attributes if we want to.
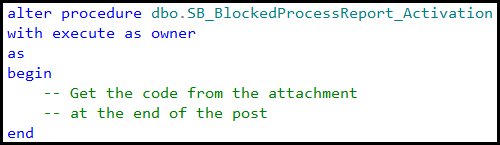
Now it’s the time to put the activation procedure in place. I’m going to cheat a little bit here – click at the link to the source code at the end of the post to see it.
There are two things I’d like to mention though. First one is how we get the query plans. For the blocked process we are trying to get it from sys.dm_exec_requests first. This is the only bullet-proof way to get the real plan but it would work only if the statement is still blocked when activation SP executes. If this is not the case we are using sys.dm_exec_query_stats DMV. There are a couple challenges though. First, there is the chance that plan would not be there – for example in case of the memory pressure. Alternatively we have the situation when there are multiple plans due recompilation. We are trying to guess the right one by filtering based on the blocking time but that method is not always working. So no guarantees. For the blocking process we are always using sys.dm_exec_query_stats picking up the top (random) plan.

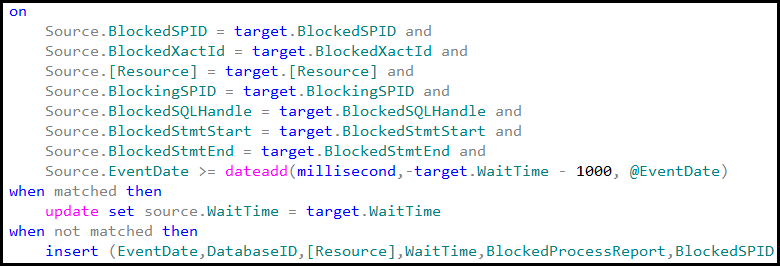
Another thing is how we are looking up if there are other events for the same blocking. Basically stored procedure is trying to match various columns in the merge statement – perhaps even more than needed – but in either case I’d rather have duplicate records than incorrect information.
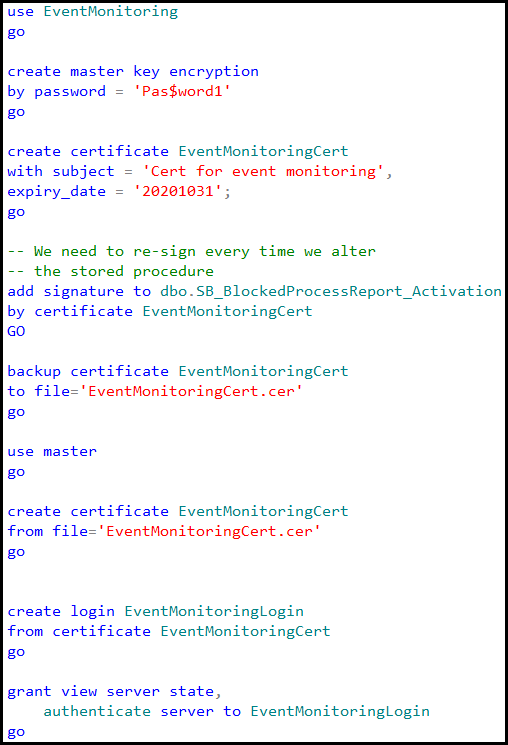
Last step we need to do is setting up the security. That step is kind of optional in case if we are storing the data in the user database but in our case, when we create the blank database and set up everything under “dbo” user it’s required. When Service Broker activates the stored procedure under that security context (EXECUTE AS OWNER), dbo has enough rights to deal with the database object. But that user also needs to have the rights to query system DMV. As result, we need to create the certificate in the both, EventMonitoring and master databases, create the login from the certificate, grant this login “view server state” and “authenticate server” rights and finally sign the stored procedure with the certificate. Or, perhaps, mark the database as Trustworthy 🙂
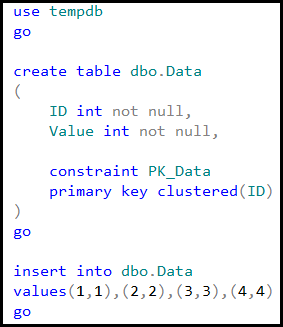
And now it’s time for the testing. Let’s create the small table and populate it with a few records.
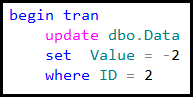
Next, let’s place exclusive (X) lock on one of the rows in the first session.
In another session let’s introduce the table scan in read committed isolation level.
![]()
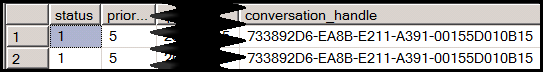
If we query the service broker queue we would see that there are a few events there. Our queue does not have automatic activation yet.

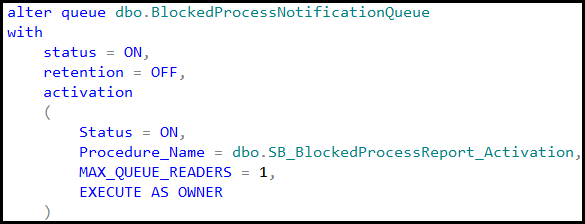
And finally let’s alter the queue to enable the activation.
Next, let’s query the table.

As we can see, there is the single record in the table now – exactly what we need. This approach is, of course, customizable. You can collect other statistics by changing the implementation. Hope, that script would be the great starting point
Next: Implementing Critical Sections / Mutexes in T-SQL
This is great (conceptually) only the SP doesn’t seem to work. I get error:
Msg 102, Level 15, State 1, Procedure SB_BlockedProcessReport_Activation, Line 51
Incorrect syntax near ‘MERGE’.
Msg 156, Level 15, State 1, Procedure SB_BlockedProcessReport_Activation, Line 181
Incorrect syntax near the keyword ‘as’.
Its referring to:
MERGE into dbo.BlockedProcessesInfo as Source
&
) as Target
Are you aware of this? Is there a fix? This is on:
Microsoft SQL Server 2005 – 9.00.5266.00 (X64) Mar 17 2011 15:18:02 Copyright (c) 1988-2005 Microsoft Corporation Enterprise Edition (64-bit)
I just found out about this:
Since the MERGE command is a new improvement in T-SQL with MS SQL SERVER 2008, you may not be able to execute your merge statement on MS SQLSERVER 2005 databases.
So is there a fix that works with 2005?
Hi Armani,
MERGE operator had been introduced in SQL Server 2008. I don’t have SQL Server 2005 to test it right now but you should be able to do something like that:
declare
@Resource varchar(64),
@WaitTime int,
@BlockedSPID smallint
— other variables – use BlockedProcessInfo table as the reference
— Select from using part of the merge
select
@Resource = repData.[Resource], @WaitTime = repData.WaitTime, @BlockedSPID = repData.BlockedSPID
from
— Parsing report XML
…
) BlockingQSPlan
update Source
set
Source.WaitTime = @WaitTime
from
dbo.BlockedProcessInfo Source
where –on part of the merge
Source.BlockedSPID = @BlockedSPID and
IsNull(Source.BlockedXactId,-1) = IsNull(@BlockedXactId,-1) and
Source.[Resource] = @Resource and
Source.BlockingSPID = @BlockingSPID and
Source.BlockedSQLHandle = @BlockedSQLHandle and
Source.BlockedStmtStart = @BlockedStmtStart and
Source.BlockedStmtEnd = @BlockedStmtEnd and
Source.EventDate >= dateadd(millisecond,-@WaitTime – 100, @EventDate)
if @@ROWCOUNT = 0 — no record found -> insert part from Merge
insert into dbo.BlockedProceesInfo(EventDate,DatabaseID,[Resource],WaitTime,BlockedProcessReport,BlockedSPID
,BlockedXactId,BlockedLockMode,BlockedIsolationLevel,BlockedSQLHandle,BlockedStmtStart
,BlockedStmtEnd,BlockedSql,BlockedInputBuf,BlockedQueryPlan,BlockingSPID,BlockingStatus
,BlockingTranCount,BlockingSql,BlockingInputBuf,BlockingQueryPlan)
values(@EventDate,@DBID,@Resource,@WaitTime
,@Report,@BlockedSPID,@BlockedXactId,@BlockedLockMode
,@BlockedIsolationLevel,@BlockedSQLHandle,@BlockedStmtStart
,@BlockedStmtEnd,@BlockedSql,@BlockedInputBuf,@BlockedQueryPlan
,@BlockingSPID,@BlockingStatus,@BlockingTranCount
,@BlockingSql,@BlockingInputBuf,@BlockingQueryPlan);
Hey,
I used this solution few times but I find that it doesn’t work always. Some servers does and some doesn’t which is increadibly weird!! Why, because it completes the script without errors and creates everything but it doesn’t actually record any info in the table. For example I have it on one server which is:
Microsoft SQL Server 2008 (SP3) – 10.0.5512.0 (X64) Microsoft Corporation Enterprise Edition (64-bit)
and it works just fine but then on my:
Microsoft SQL Server 2008 R2 (SP2) – 10.50.4286.0 (X64) Microsoft Corporation Enterprise Edition (64-bit)
it doesn’t record anything. I had this happen a few times. Its extremely useful when it works and Id like to get to bottom of it why its not working on some systems.
Thanks!
Just as I sent that question I found the problem – I was comparing the two servers line by line and I realized that on the one where it doesn’t work, the BlockedProcessNotificationQueue was disabled. When I expanded Service Broker – queues, I realized its marked as disabled! Not sure why but it was and as soon as I enabled it everything worked fine. Keep in mind I tested this many times so maybe needs some scrip adjustment but why only on some servers?
Hi and thank you for the comments!
The queue could become disabled in case of poison message / unhandled exception in activation proc. I am using this script in quite a few servers however there is always possibility of the bugs 🙂
I will adjust it a little bit and add similar script for deadlock detection when I have time, which realistically happen when I am done with the book (sign).
Again, thank you!
Thanks, Dimitri.
Really great stuff.
BTW. I’m also interested in a version for the “DEADLOCK_GRAPH”..
Patrick
Thank you, Patrick!
It is in my list – I just need to find time to do that. 🙂
Thanks,
Dmitri
Thank you so much for the detailed Steps. Can you please send the same script to my email.
Thank you for looking into this.