I hope you are OK during those turbulent times!
People often ask me about my most curious experience in SQL Server consulting. Well, as many of my colleagues, I have a lot of stories to tell (though many of them are still under NDA). One of my favorite ones is the story about the case when I was able to solve all performance problems on the server in just a few minutes.
We, Database Professionals, love monitoring tools. They allow us to be more proactive and reduce incident detection and recovery times. Unfortunately, the benefits do not come for free – every type of monitoring adds the overhead to the system. In some cases, this overhead may be negligible and acceptable, in others – it may have significant impact to the server performance.
I have seen many cases of inefficient monitoring. For example, I saw the tool that provided the information about index fragmentation by calling sys.dm_db_index_physical_stats function in DETAILED mode for every index in the database doing it every 4 hours. I also saw the tool, that constantly polled sys.dm_exec_requests view joining it with sys.dm_exec_query_plan function. It did not work very well on the system that handled hundreds of concurrent requests all the time.
It is relatively easy with the tools – you can detect those inefficiencies just by looking at the expensive queries in the system. This is not always the case, however, with other technologies, like with monitoring done by Extended Events. They can stay almost invisible in the system, especially if targets are keeping up and don’t generate waits.
Let me show you an example and create xEvent session that captures queries that were executed in the system. This is very common one, is not it?
create event session CaptureQueries on server
add event sqlserver.rpc_completed

(

  set collect_statement=(1)

  action

  (

    sqlos.task_time,sqlserver.client_app_name

    ,sqlserver.client_hostname

    ,sqlserver.database_name

    ,sqlserver.nt_username

    ,sqlserver.sql_text

  )

),

add event sqlserver.sql_batch_completed(

  action

  (

    sqlos.task_time

    ,sqlserver.client_app_name

    ,sqlserver.client_hostname

    ,sqlserver.database_name

    ,sqlserver.nt_username

    ,sqlserver.sql_text

  )

),

add event sqlserver.sql_statement_completed

add target package0.event_file

(set filename=N'C:\PerfLogs\LongSql.xel',max_file_size=(200))

with

(

  max_memory=4096 KB

  ,event_retention_mode=allow_single_event_loss

  ,max_dispatch_latency=5 seconds

)
As the next step, let’s deploy it to the server that operates under heavy load with large number of concurrent requests. We will measure the throughput in the system with and without xEvent session running. Obviously, be careful and do not run it on production servers!
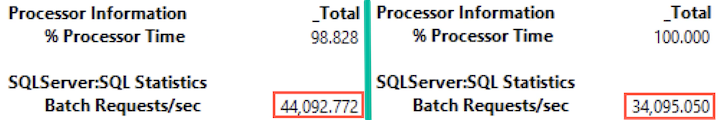
Figure 1 below illustrates CPU load and number of batch requests per second in both scenarios. As you see, enabling xEvent session led to more than 20% decrease of throughput in the system.
And coming back to my story – this is exactly what happened. The customer had very similar session running. Amazingly, but not surprisingly, nobody used collected data. The team was unaware that this session even existed.
After some investigation, they found that they created this session several months ago during investigation of some performance issues. After investigation had been completed, they stopped the session. Unfortunately, they overlooked that the session was created with “Start the event session at server startup” flag. At some point the server was patched, rebooted and voila!
I did not make much money from that case – after all, I am billing by the hour. But the look at the customer’s face was priceless!
The morale of this story – be careful with the monitoring. Know what you are doing and do not keep unnecessary data collectors running.
This is the link to the video version of this blog post. 🙂