I hope everyone had the great holiday season! 🙂
Today I’d like us to talk about Lock Escalation in Microsoft SQL Server. We will cover:
- What is Lock Escalation?
- How Lock Escalations affects the system
- How to detect and troubleshoot Lock Escalations
- How to disable Lock Escalation
What is Lock Escalation?
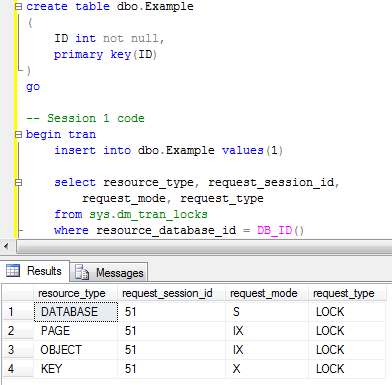
All of us know that SQL Server uses row level locking. Let’s think about scenario when system modifies the row. Let’s create the small table and insert 1 row there and next check the locks we have. As usual every image is clickable.
As you can see there are 4 locks in the picture. shared (S) lock on the database – e.g. indication that database is in use. Intent exclusive (IX) lock on the table (OBJECT) – e.g. indication that one of the child objects (row/key in our case) has the exclusive lock. Intent exclusive (IX) lock on the page – e.g. same indication about child object (row/key) exclusive lock. And finally exclusive (X) lock on the key (row) we just inserted.
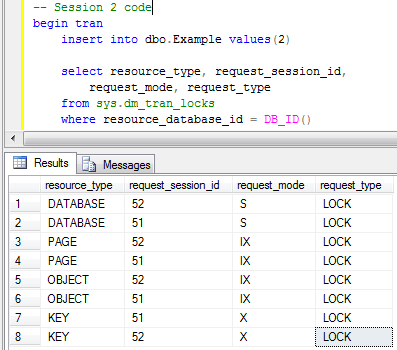
Now let’s insert another row in the different session (let’s keep the original Session 1 transaction uncommitted).
When we check the locks we will see that there are 8 locks – 4 per session. Both sessions ran just fine and don’t block each other. Everything works smooth – that great for the concurrency. So far so good. The problem though is that every lock takes some memory space – 128 bytes on 64 bit OS and 64 bytes on 32 bit OS). And memory is not the free resource. Let’s take a look at another example. I’m creating the table and populating it with 100,000 rows. Next, I’m disabling the lock escalation on the table (ignore it for now) and clear all system cache (don’t do it in production). Now let’s run the transaction in repeatable read isolation level and initiate the table scan.
Transaction is not committed and as we remember, in repeatable read isolation level SQL Server holds the locks till end of transaction. And now let’s see how many locks we have and how much memory does it use.

As you can see, now we have 102,780 lock structures that takes more than 20MB of RAM. And what if we have a table with billions of rows? This is the case when SQL Server starts to use the process that called “Lock Escalation” – in nutshell, instead of keeping locks on every row SQL Server tries to escalate them to the higher (object) level. Let’s see how it works.
First we need to commit transaction and clear the cache. Next, let’s switch lock escalation for Data table to AUTO level (I’ll explain it in details later) and see what will happen if we re-run the previous example.
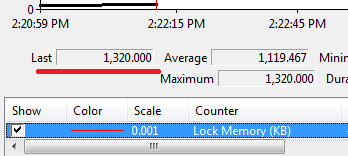
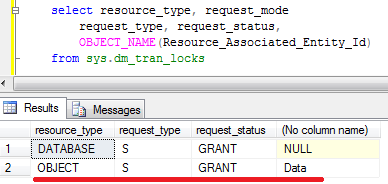
As you can see – just 2 locks and only 1Mb of RAM is used (Memory clerk reserves some space). Now let’s look what locks do we have:
As you can see there is the same (S) lock on the database and now we have the new (S) shared lock on the table. No locks on page/row levels are kept. Obviously concurrency is not as good as it used to be. Now, for example, other sessions would not be able to update the data on the table – (S) lock is incompatible with (IX) on the table level. And obviously, if we have lock escalation due data modifications, the table would hold (X) exclusive lock – so other sessions would not be able to read the data either.
The next question is when escalation happens. Based on the documentation, SQL Server tries to escalate locks after it acquires at least 5,000 locks on the object. If escalation failed, it tries again after at least 1,250 new locks. The locks count on index/object level. So if Table has 2 indexes – A and B you have 4,500 locks on the index A and 4,500 locks on the index B, the locks would not be escalated. In real life, your mileage may vary – see example below – 5,999 locks does not trigger the escalation but 6,999 does.
How it affects the system?
Let’s re-iterate our first small example on the bigger scope. Let’s run the first session that updates 1,000 rows and check what locks are held.
As you see, we have intent exclusive (IX) locks on the object (table) and pages as well as various (X) locks on the rows. If we run another session that updates completely different rows everything would be just fine. (IX) locks on table are compatible. (X) locks are not acquired on the same rows.

Now let’s trigger lock escalation updating 11,000 rows.
As you can see – now the table has exclusive lock. So if you run the session 2 query from above again, it would be blocked because (X) lock on the table held by session 1 is incompatible with (IX) lock from the session 2.
When it affects us? There are 2 very specific situations
- Batch inserts/updates/deletes. You’re trying to import thousands of the rows (even from the stage table). If your import session is lucky enough to escalate the lock, neither of other sessions would be able to access the table till transaction is committed.
- Reporting – if you’re using repeatable read or serializable isolation levels in order to have data consistent in reports, you can have (S) lock escalated to the table level and as result, writers will be blocked until the end of transaction.
And of course, any excessive locking in the system can trigger it too.
How to detect and troubleshoot Lock Escalations
First of all, even if you have the lock escalations it does not mean that it’s bad. After all, this is expected behavior of SQL Server. The problem with the lock escalations though is that usually customers are complaining that some queries are running slow. In that particular case waits due lock escalations from other processes could be the issue. If we look at the example above when session 2 is blocked, and run the script (as the session 3) that analyzes sys.dm_tran_locks DMV, we’d see that:
I’m very heavy on the wait statistics as the first troubleshooting tool (perhaps heavier than I need to be 🙂 ). One of the signs of the issues with lock escalations would be the high percent of intent lock waits (LCK_M_I*) together with relatively small percent of regular non-intent lock waits. See the example below:
In case if the system has high percent of both intent and regular lock waits, I’d focus on the regular locks first (mainly check if queries are optimized). There is the good chance that intent locks are not related with lock escalations.
In addition to DMVs (sys.dm_tran_locks, sys.dm_os_waiting_tasks, sys.dm_os_wait_stats, etc), there are Lock Escalation Profiler event and Lock Escalation extended event you can capture. You can also monitor performance counters related with locking and create the baseline (always the great idea)
Last but not least, look at the queries. As I mentioned before in most part of the cases excessive locking happen because of non-optimized queries. And that, of course, can also trigger the lock escalations.
How to disable Lock Escalation
Yes, you can disable Lock Escalations. But it should be the last resort. Before you implement that, please consider other approaches
- For data consistency for reporting (repeatable read/serializable isolation levels) – switch to optimistic (read committed snapshot, snapshot) isolation levels
- For batch operations consider to either change batch size to be below 5,000 rows threshold or, if it’s impossible, you can play with lock compatibility. For example have another session that aquires IS lock on the table while importing data. Or use partition switch from the staging table if it’s possible
In case if neither option works for you please test the system before you disable the lock escalations. So:
For both SQL Server 2005 and 2008 you can alter the behavior on the instance level with Trace Flags 1211 and 1224. Trace flag 1211 disables the lock escalation in every cases. In case, if there are no available memory for the locks, the error 1204 (Unable to allocate lock resource) would be generated. Trace flag 1224 would disable lock escalations in case if there is no memory pressure in the system. Although locks would be escalated in case of the memory pressure.
With SQL Server 2005 trace flags are the only options you have. With SQL Server 2008 you can also specify escalation rules on the table level with ALTER TABLE SET LOCK_ESCALATION statement. There are 3 available modes:
- DISABLE – lock escalation on specific table is disabled
- TABLE (default) – default behavior of lock escalation – locks are escalated to the table level.
- AUTO – if table is partitioned, locks would be escalated to partition level when table is partitioned or on table level if table is not partitioned
Source code is available for download


Nice article on ‘Lock escalation’.
Thanks!!
Thank you, Sharad!
Very Nice article
Here’s how you see if the options are on or not:
select lock_escalation, lock_escalation_desc, name from sys.tables
Here’s how to do some permutations of the settings in 2008+
ALTER TABLE schema.tablename SET (LOCK_ESCALATION=DISABLE)
ALTER TABLE schema.tablename SET (LOCK_ESCALATION=TABLE)
ALTER TABLE schema.tablename SET (LOCK_ESCALATION=AUTO)
Thank you, Jason!
Pingback: Lock escalation | Learn something new a day
excellent article.thanks for examples
Hi,
It is great great gret article….
Amzing..
Thank you so much.
Pingback: SharePoint exceeds the List view Threshold limit to 5000 items. Why 5000? | *****## R.MARAN. ## *****
Pingback: sql server – Are explicit transactions needed in this while loop? | Asking
what will be the effect if we disable the lock escalation for the deadlock.
Usman,
It really depends on why you have the deadlock. Frankly, I rarely saw deadlocks due to lock escalations. You need to look at deadlock graph to find the root cause of the issue.
Disabling lock escalation would help to reduce blocking due to large batch updates.
Dmitri